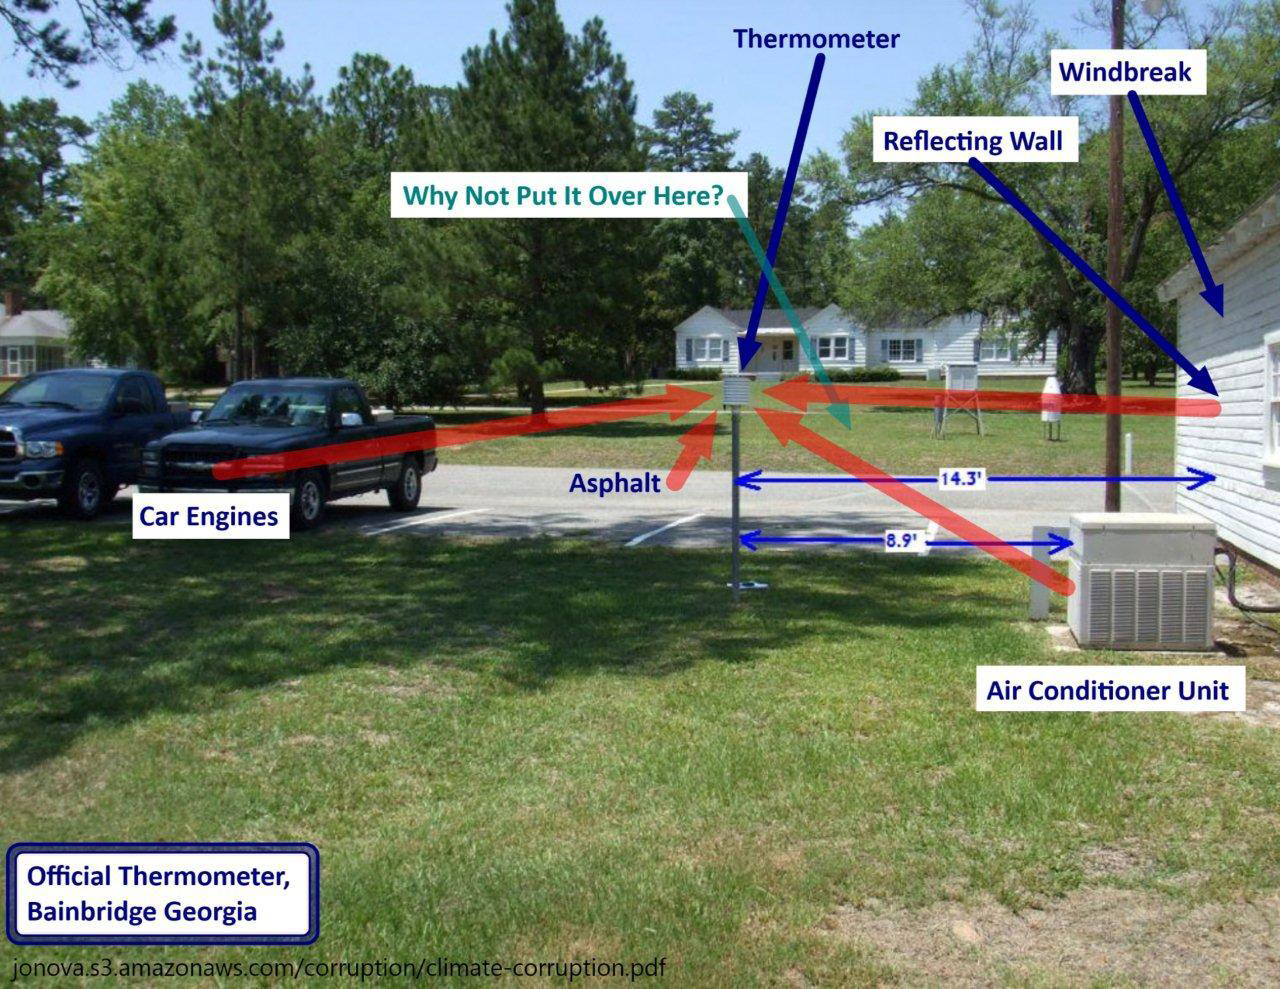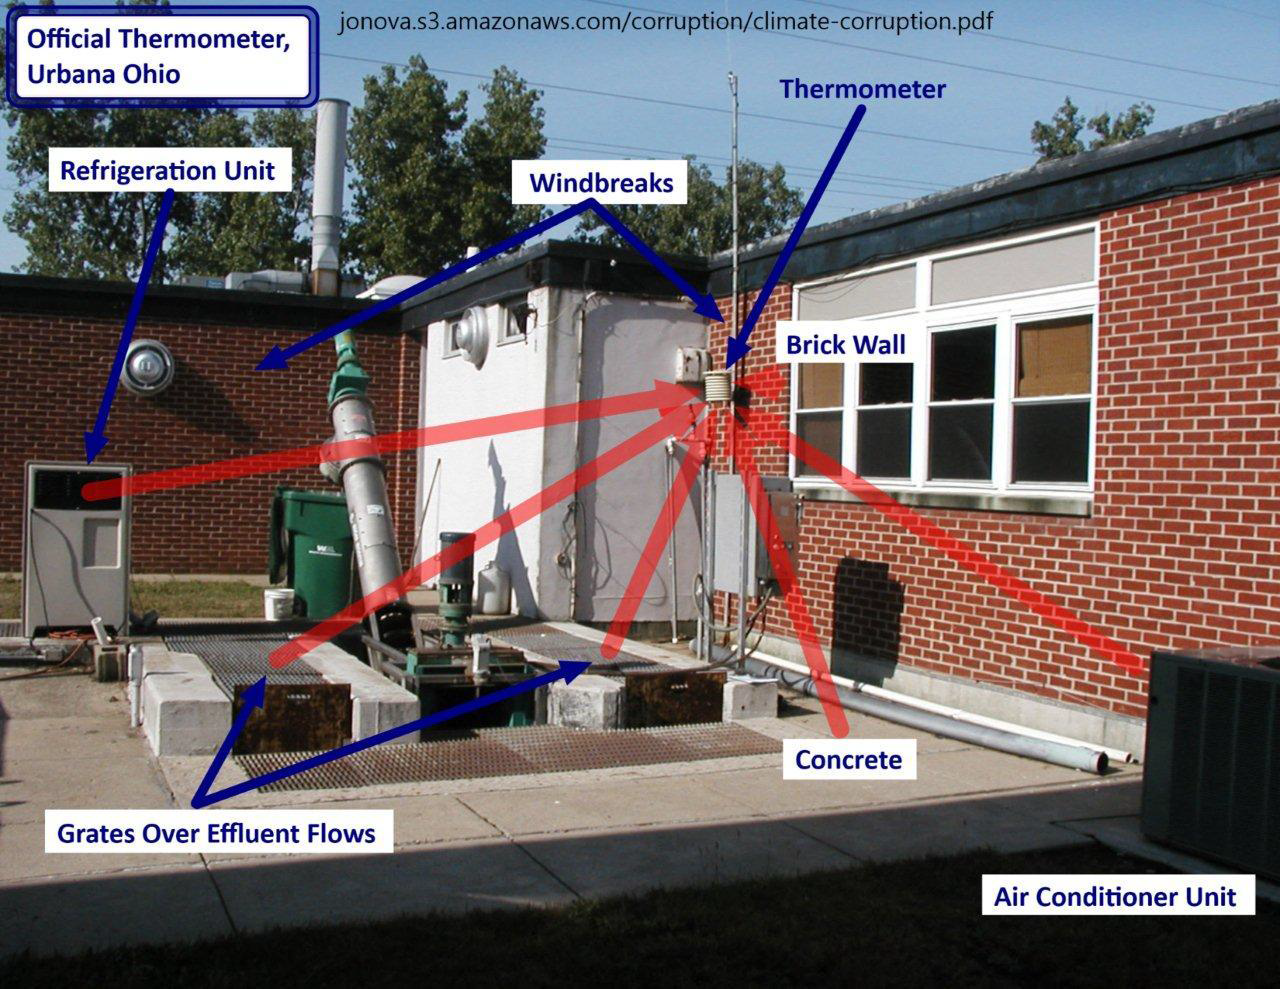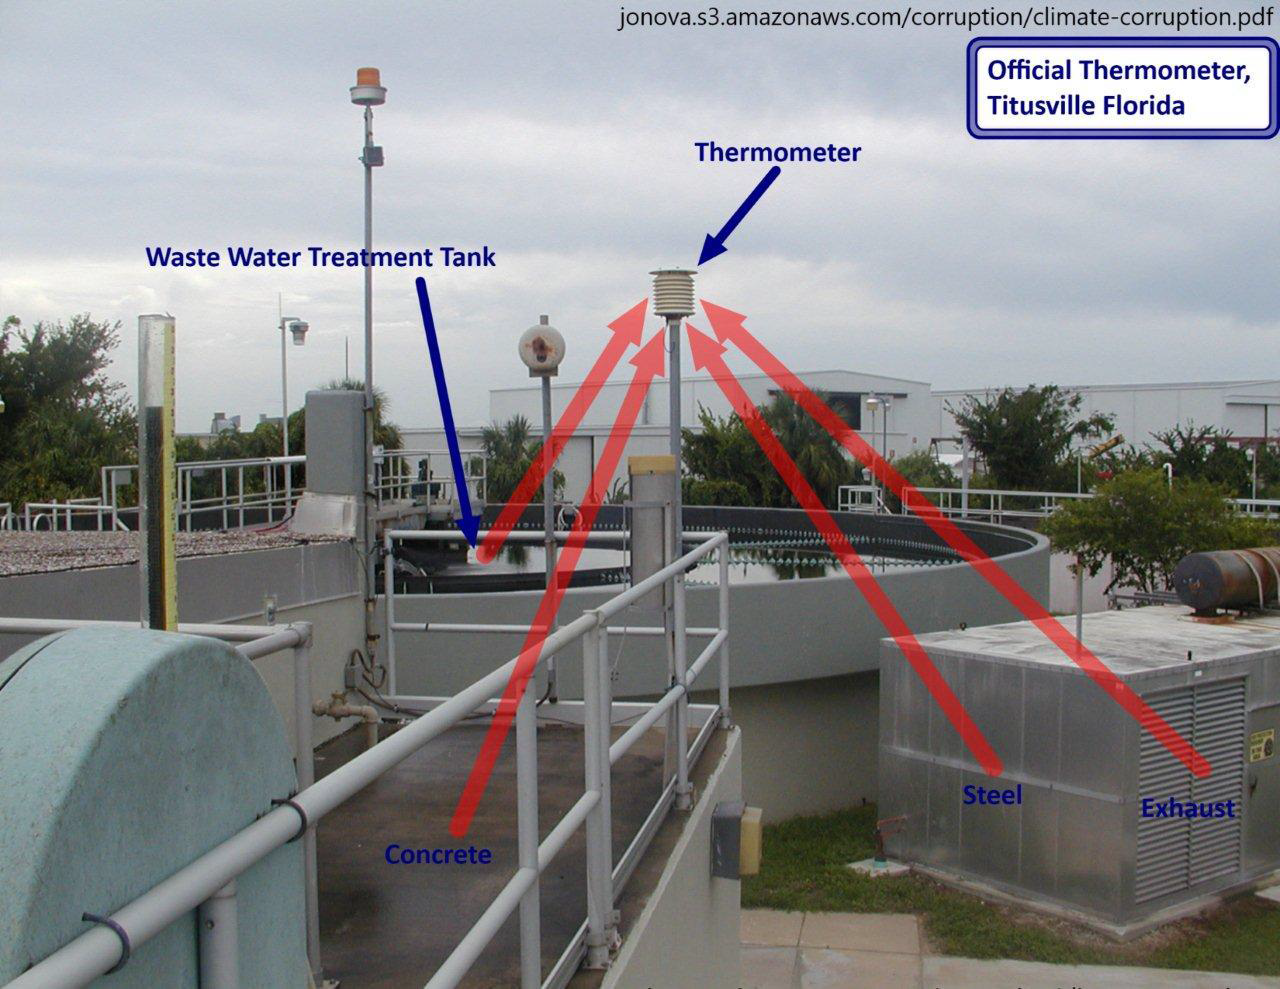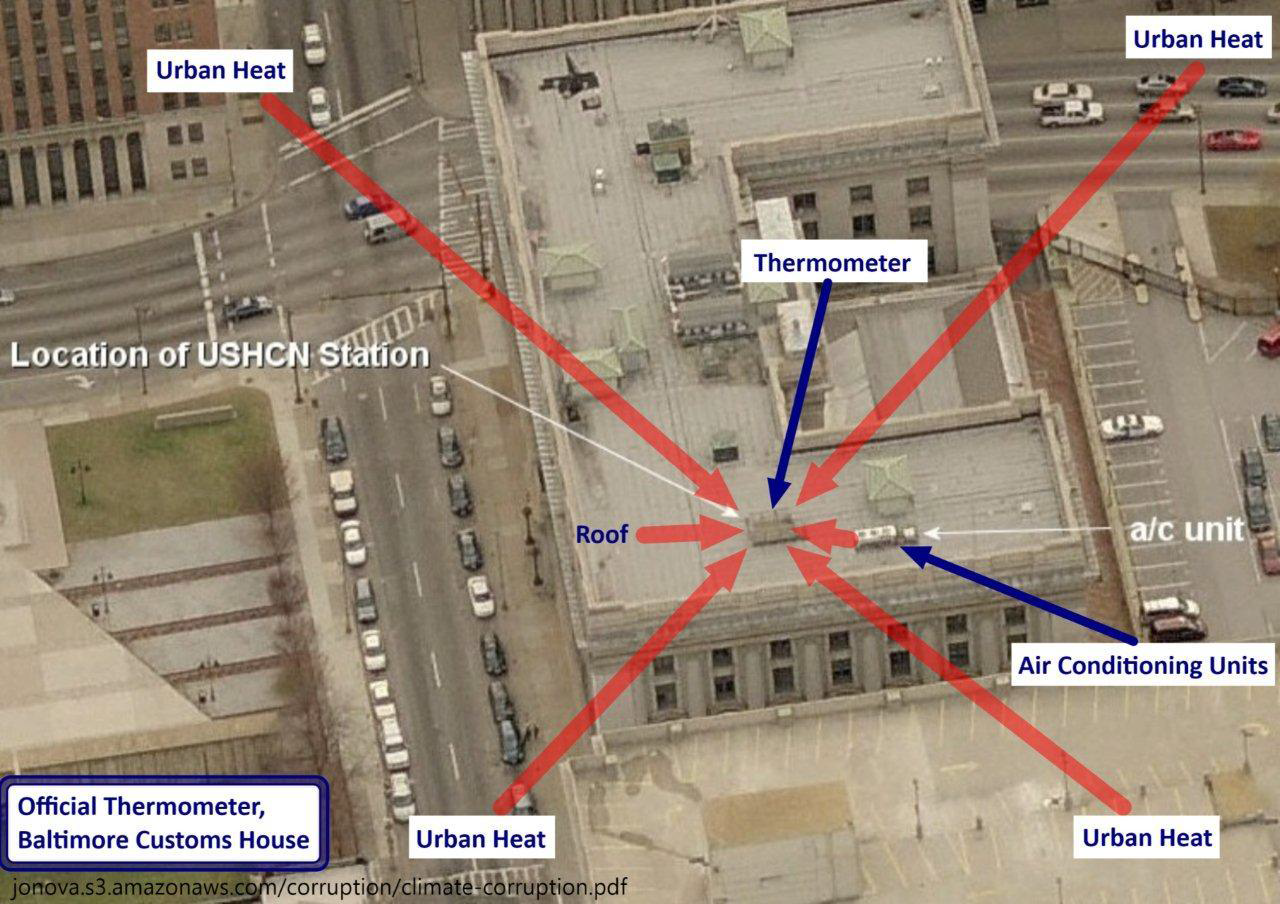
. . . One “cause” of rising average global temperatures is the urban heat island effect. Cities are hotter than rural areas. Many of the reporting stations that were once in undeveloped rural areas have experienced either suburban or urban development, or the stations have been moved to more urban settings. It is well documented that some have been, seemingly intentionally, relocated near or at heat sources such as paved parking lots and air conditioners.
One reason for relocation near buildings or other structures could be that new automatic-reporting equipment needs to be connected by cable. Rather than dig up parking lots or roads to install units in a grassy or protected area, many have opted to locate them where they can be directly connected without involving costly excavation, although such sites do not meet the stated requirements. Instead of excluding data from stations that are poorly situated, a convoluted mathematical algorithm (scheme) is used to “correct” it to presumed pre-industrial levels. See illustrations below.
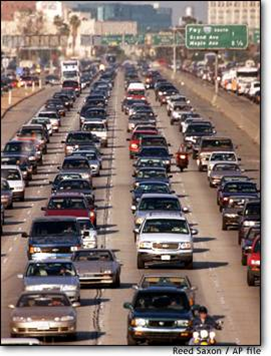
One additional problem with the newer sensors is their fast response. Since they record the high and low temperature point each day, not the average, they can report a transient heat source like a passing bus, an idling auto or jet engine exhaust at the airport instead of the actual ambient temperature.
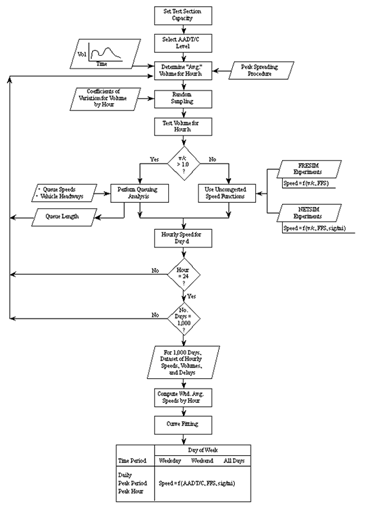
Urban area plus mathematical correction algorithm equals pristine nature
Source: “The Influence of anthropic surface processes and inhomogeneities on gridded global climate data” Slide 21, Powerpoint presentation to the American Chemical Society, Denver CO via Webinar, August 28 2011 by Ross McKitrick, Department of Economics, University of Guelph, Guelph ON Canada http://www.rossmckitrick.com/general-overviews.html
Proposed rating of reporting stations with regard to surroundings:
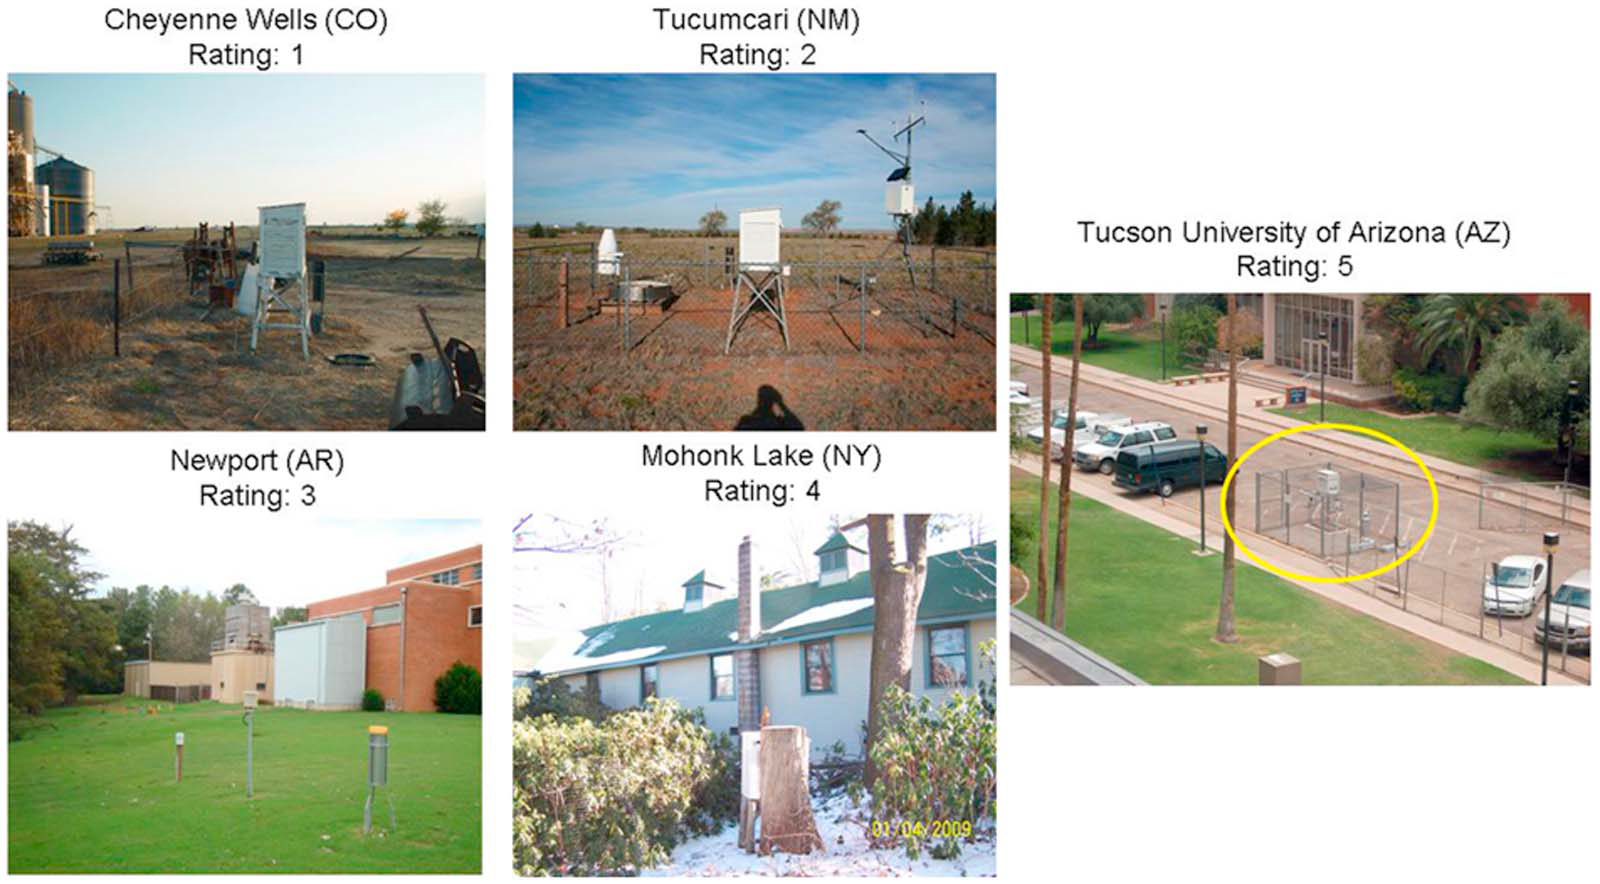
Figure 3. U.S. Historical Climate Network (USHCN) station exposure at sites representative of each CRN class: CRN 1, a clear flat surface with sensors located at least 100 m from artificial heating and vegetation ground cover <10 cm high; CRN 2, same as CRN 1 with surrounding vegetation <25 cm and artificial heating sources within 30 m; CRN 3, same as CRN 2, except no artificial heating sources within 10 m; CRN 4, artificial heating sources <10 m; and CRN 5, sensor located next to/above an artificial heating source.
Source: “Analysis of the impacts of station exposure on the U.S. Historical Climatology Network temperatures and temperature trends,” Souleymane Fall, Anthony Watts, John Nielsen‐Gammon, Evan Jones, Dev Niyogi, John R. Christy,5and Roger A. Pielke Sr., Journal of Geophysical Research, Vol. 116, D116, D14120 doi:10.1029/2010JD015146, 2011
See other examples below of poor placement of temperature reporting stations from “Is the Western Climate Establishment Corrupt?” The public might not understand the science, but they do understand cheating, Dr. David Evans, 11 Nov 2010 (last updated 28 Feb 2011) Web Address: jonova.s3.amazonaws.com/corruption/climate-corruption.pdf