AGW Claims vs. Truth – Claim 7. Temperatures have risen faster in recent years than ever before


082015_1920_1.png
Average Global Temperatures vs Number of Reporting Stations

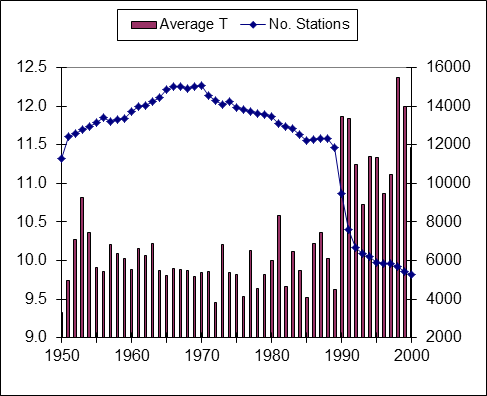
Truth: Remember that there is no such thing as a global temperature. It is the average of all of the reporting stations all over the world. For example, several years ago Ross McKitrick[1] using CRU data showed that the rapid rise in temperatures in the 1990s directly coincided with a decrease in the number of Siberian weather stations reporting due to the break-up of the Soviet Union.

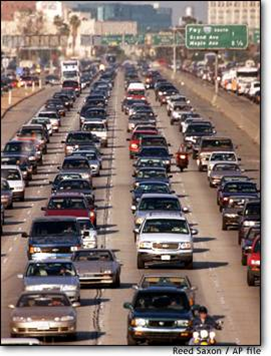
Additionally, the “hottest year on record,” 1998, was an El Nino year so it was naturally hotter than the years just before and after. Another cause of rising average global temperatures is the urban heat island effect. Cities are hotter than rural areas.

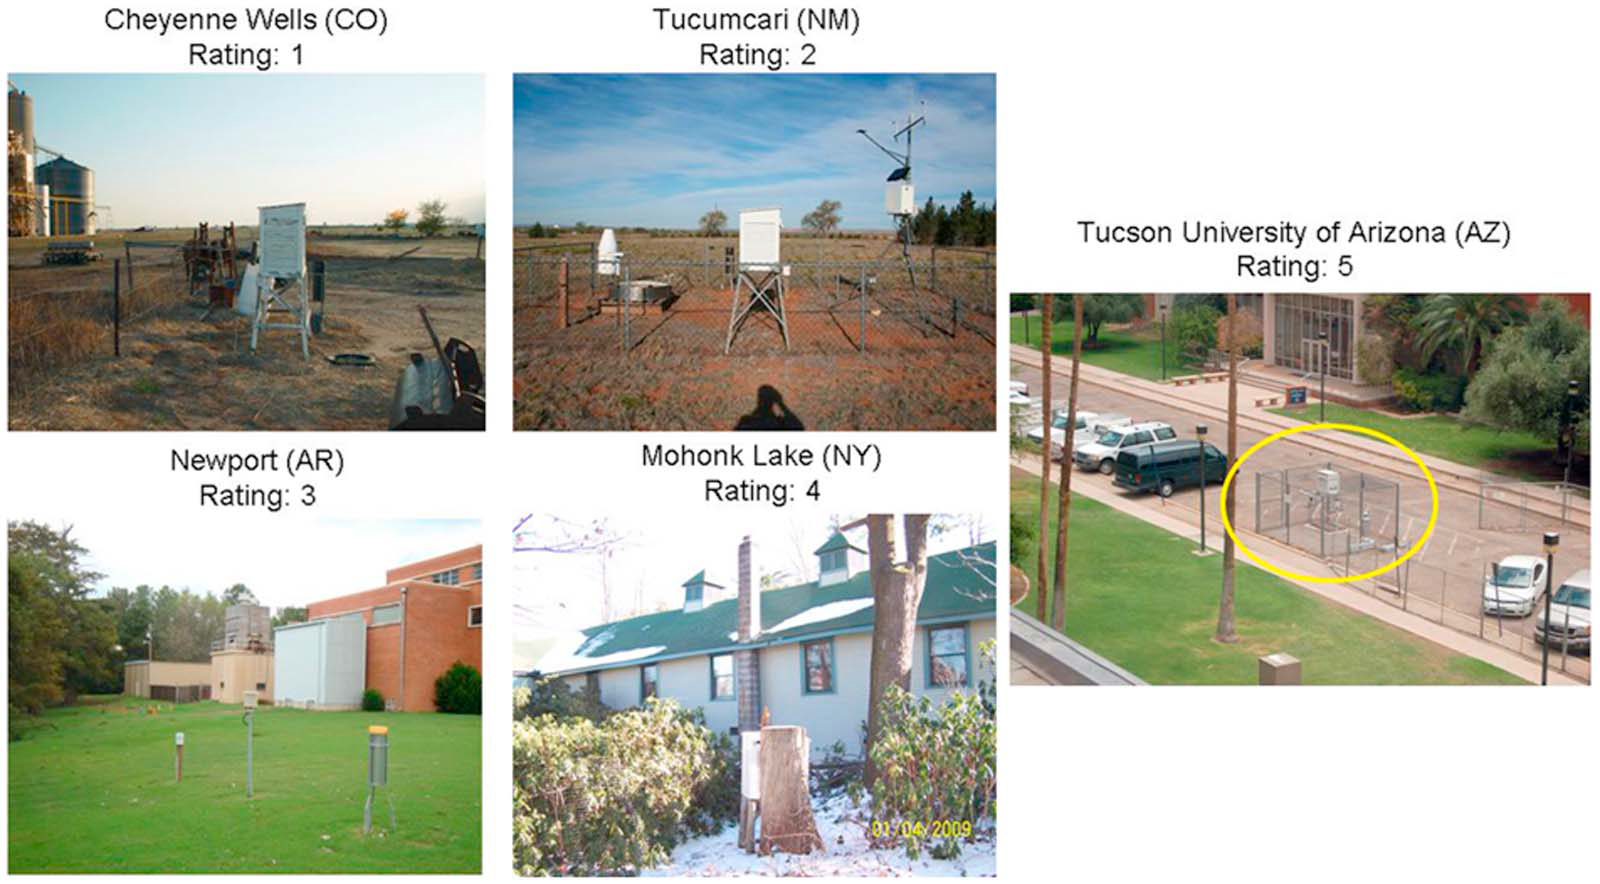
Many of the reporting stations that were once in undeveloped rural areas have experienced either suburban or urban development, or the stations have been moved to more urban settings. It is well documented that some have been, seemingly intentionally, relocated near or at heat sources such as paved parking lots and air conditioners.Urban Heat 1 
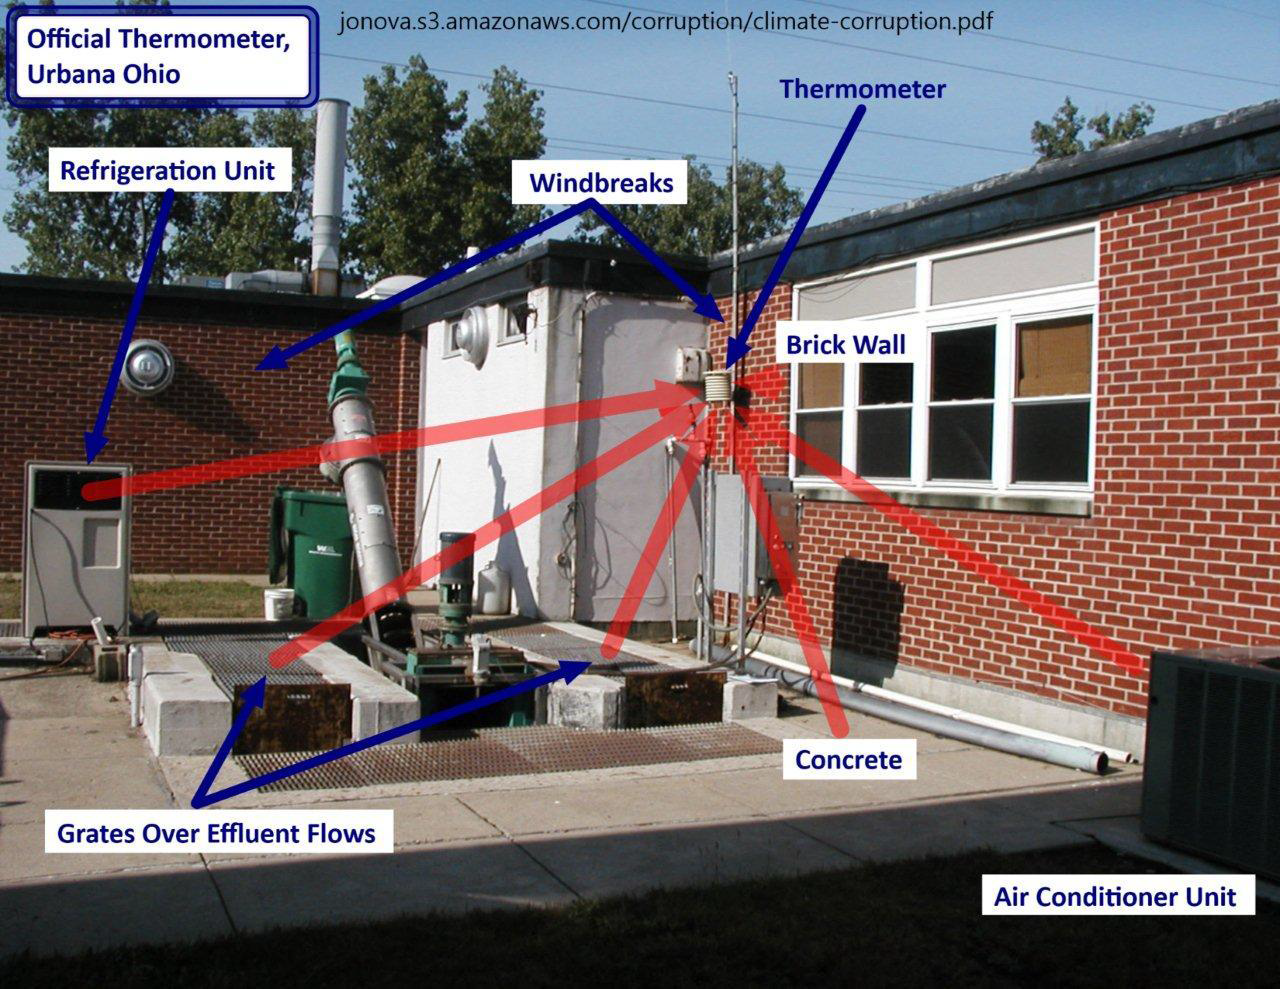
One reason for relocation near buildings or other structures could be that new automatic-reporting equipment needs to be connected by cable. Rather than dig up parking lots or roads to install units in a grassy or protected area, many have opted to locate them where they can be directly connected without involving costly excavation, although such sites do not meet the stated requirements.

Urban Heat 5
Rating system for locating weather stations

Instead of excluding data from stations that are poorly situated, a convoluted mathematical algorithm (scheme) is used to “correct” it to presumed pre-industrial levels. In spite of all this, it appears that there has been no net warming since the late 1990s and even a slight cooling since 2005. One other problem with the new equipment is that it has a faster response time that records brief, transient signals such as car or plane exhausts that were not picked up by the older equipment. Because the equipment is designed to report maximum and minimum temperatures, this can create a false result.

Urban Heat 6
Urban Locations
Urban Heat 8
Plus Correction Algorithms
100_0070B
“equals” pristine natural setting


[1] Ross McKitrick, Professor of Economics and CBE Chair in Sustainable Commerce, University of Guelph, Guelph, Ontario, Canada http://www.rossmckitrick.com

AGW Claims vs Truth – Claim 6. Temperatures are hotter than in the last 100,000 years

Global Temperatures 2500 BC to 2040 AD

Claim 6. Temperatures are hotter now than they have been in the last 100,000 years

Truth: This is clearly an unsubstantiated myth meant to scare people into compliance with drastic environmental regulations.  The climate modelers have eliminated the Medieval Warm Period, which was hotter than it is today, and it was a time of prosperity. It was hotter in the 1930s than it is today. However, the American “Dust Bowl” of the 1930s was not due to warming. It was caused by opening up vast areas to farming that were poorly suited to it and a years-long severe drought. Based on historical accounts, ice cores and tree rings, modelers have dismissed the Medieval Warm Period and the Little Ice Age by claiming that they were not global phenomena but were limited to Europe and North America. More recent and more detailed ice core studies, etc. have shown that both of these periods were indeed global. Over the last 100,000 years, temperatures have been far hotter and far colder than the present.  Who can say what “normal” global temperature is when it is always changing?  Should we attempt to freeze the present day conditions as the ideal, or should we take a more reasonable approach to an ever changing climate?

15 climate chart - 11K yrs vs CO2
11,000 year record of Temperatures vs. CO2

AGW Claims vs. Truth – 5. Developed countries are to blame for increased manmade carbon dioxide because they use most of the fossil fuels.

Global coal consumption

Truth: This is partially true. Industrialization is steadily increasing in developed and developing countries such as China and India. While developed countries are putting restrictions on themselves, international agreements exempt developing countries from such restrictions. These increases more than offset any gains from restrictions on developed countries.  However, see previous post AGW Claims vs. Truth – 2 & 2b for why we shouldn’t worry about increased CO2

In addition to industrialization, increased cooking fires and subsistence agriculture to feed an increasing population are also significant contributing factors. CO2 is CO2. There is no escape clause for renewable sources. It doesn’t matter whether it is from fossil fuels or burning dung or wood. Increased population in developing countries means more slash and burn agriculture and more cooking and heating by burning organic material. The modelers assume that renewable sources are exempt as causes because it is a renewable source. This is faulty thinking. Slash and burn agriculture of one acre releases a tenth of the carbon dioxide as ten acres. Subsistence agriculture is harmful to the environment because it results in depletion of soils so that it is necessary to clear more forest lands.

Subsistence farming requires burning to release the nitrogen for crops. Modern agriculture releases far less carbon dioxide than subsistence farming, so keeping people in poverty makes no sense unless your aim is to control or reduce the population in developing countries. It would be better if we helped developing countries develop modern agriculture and industry so they can clean up their act. When people are worried about how to feed their families, there is little time or incentive to do anything about pollution or the environment. In many underdeveloped countries the tradition of having as many children as possible is mostly due to the high rate of mortality in infancy and childhood from unchecked diseases, poor diet, indoor air pollution and poverty. Without the incentive of high infant and childhood mortality, family size and populations could naturally stabilize.

World Life Expectancy Map
World Life Expectancy Map which tracks well with Poverty Rates
LifeExpectancy_GDPperCapita - wiki
Life Expectancy vs. GDP per capita, 2009, World Bank


New Book Now Available on Amazon and wnd.com

Perverted Truth Exposed cover image

In Perverted Truth Exposed, Kay Kiser exposes areas of science that have been corrupted by progressive and atheist philosophies disguised as science, including the theories of evolution, origin of life, cosmology, and quantum physics.

The climate change debate presents a modern example of how the perversion of science is politically imposed to support an anti-God, anti-human progress agenda of Marxist control and power while silencing opposition through intimidation. Kiser also answers:

  • Did Darwin really steal his theory of evolution from Alfred Wallace?
  • Why did Wallace later abandon the theory as not having sufficient evidence?
  • If Hubble discovered the expanding universe leading to the Big Bang Theory, why did he continually try to convince others that their conclusion was wrong?
  • Is man-made carbon dioxide causing global warming or is it a trailing indicator of climate change in a system dominated by solar cycles, cloud cover, and ocean currents?

My book has just been published and is available at Amazon.com World Net Daily Books @wnd.com and other outlets.  Soon to be available as an eBook.

http://superstore.wnd.com/Perverted-Truth-Exposed-How-Progressive-Philosophy-Has-Corrupted-Science-Paperback