AGW Claims vs. Truth – 2. Carbon Dioxide and Warming

Atmospheric Transmission of Different Gases

AGW Claim 2. Manmade carbon dioxide (CO2) is the main cause of global warming

Truth: a.) Carbon dioxide is a minor player in any further warming. It is uniformly distributed in the atmosphere but only absorbs infrared (heat) in a very narrow wavelength range. The CO2 wavelength range is outside the range of most of the solar radiance that penetrates our atmosphere. It falls roughly inside the wavelength range of temperatures re-radiated when solar radiation heats the Earth’s surface.

The atmospheric CO2 already absorbs almost all of the radiation that it can in that wavelength range. Most of the warming effect of CO2 has already occurred in the past and is one of the reasons our planet is not a frozen wasteland. Any increase in CO2 will have a very minor effect. With CO2 absorption near saturation, almost all of the re-radiated heat in that wavelength range is already being trapped, so it can have little or no effect on future increases in temperature or supposed forcing of water vapor. (will be explained in claim 3 analysis in future posts.) With CO2 essentially eliminated as a source, any increase in temperature must be from other sources.

This figure above requires a bit of explaining. The top spectrum shows the wavelengths at which the atmosphere transmits light and heat as well as the blackbody idealized curves for no absorption. It is a little misleading because the data is not based on actual solar and earth data. It is based on two experimental heat sources, one centered at 5525 K (5252o C or 9485o F), the approximate temperature of solar radiation, and one centered in the range of 210 to 310 K (-63o C to 36.8o C or -82oF to 98o F), the approximate temperature range of re-radiated heat from the earth. In reality, solar radiation power, (Watts/m2/micron), is six million times as strong as the power of re-radiated heat from the Earth.

The other spectra are absorption[1] spectra. The first one shows the relative percent absorption by total atmospheric gases at various wavelengths, (note that this spectrum is practically the inverse of the transmission spectrum above it), and the spectra below that show the absorption wavelength ranges of individual atmospheric gases, (but not the relative strength of that absorption in reality). As experimental, not real atmospheric, data they can only tell us the wavelength ranges of the absorption, not their relative strengths in the atmosphere.

Note that CO2 absorbs in the 15 micron range[2], which is within both the range of re-radiated heat and the strong absorption by water vapor, of which the CO2 peak forms a mere shoulder. CO2, in the atmosphere is evenly distributed and is near-saturation level at this wavelength.  That means that little if any re-radiated heat can escape through the blanket of CO2, which is why our earth is not a frozen wasteland.  This also mean that adding more CO2 will have little effect on future temperatures.  Lesser CO2 peaks in the 2.7 and 4.3 micron ranges only contribute in a minor way. The first is completely covered by a water vapor absorption peak and the second forms a shoulder in another water vapor peak. These minor peaks occur in a region where both solar radiation and re-radiation are minimized. Methane and nitrous oxide are also shown to be minor players, having narrow absorption ranges and are at low concentrations in the atmosphere. Note too that ozone blocks most of the ultraviolet light from the sun.

b.) Water is by far the most important greenhouse gas/liquid in the form of vapor, high and low altitude clouds, rain and snow, which both absorb and reflect in-coming sunlight and re-radiated heat from the surface. Water vapor is not uniformly distributed in the atmosphere, being concentrated near the earth, it strongly absorbs heat in a wide range of wavelengths. More heat means more water vapor evaporating from the oceans. Sounds pretty scary, doesn’t it? Contrary to what is assumed by climate modelers, who use this to claim forcing by CO2, the extra vapor doesn’t remain as vapor. It quickly forms low altitude clouds that strongly reflect in-coming sunlight and heat into space. Any re-radiated heat from the surface that may be trapped by clouds is a small fraction compared to the in-coming solar radiation, so blocking solar radiation has a net cooling effect that overwhelms any increases in trapped re-radiation. High altitude clouds tend to trap heat from being re-radiated into space, but have little effect because the increases in cloud cover due to warming are mostly in low altitude clouds.

c.) Methane, like CO2, only absorbs heat in narrow wavelength ranges far from most of solar heat radiance, so that water, with its broad absorbance spectrum, trumps all other greenhouse gases. Like CO2, methane is at or near its absorbance saturation point in the atmosphere so that increases would have little effect. While it is true that continued warming could result in release of methane from melting permafrost, it would have a relatively minor effect on global temperatures. Methane is derived mostly from decaying organic material and from natural seeps on the land and under the sea, as well as termites and ruminant flatulence. Methane absorbs 29 times as much heat per volume as carbon dioxide but at 1.8 ppbv[3], (.00000018 percent), compared to CO2 at 380 ppmv[4], (0.038 percent), it is recognized as a minor player in greenhouse warming along with Ozone (O3) and Nitrous Oxide (N2O).

CO2 Solubility in Water vs Temperature

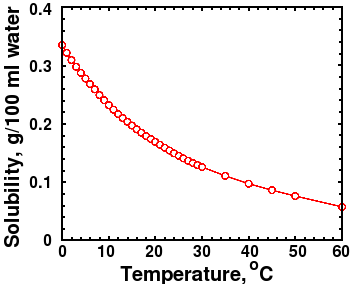
d.) Manmade carbon dioxide is estimated to be about 5 percent (1/20th) of the total CO2 emitted. Animals and man are relatively minor contributors. Decaying organic matter is the major source, followed by volcanic activity and release from warmer oceans. Warmer water releases more CO2 than cooler water due to decreased solubility of CO2 with rising temperature. Many studies show that atmospheric CO2 concentration rises AFTER warming, not before. So which is the cause and which is the effect?

See next post for the beneficial effects of CO2 on plant life.

[1] Transmission and Absorption are inversely related by the formula A = 1/log T.

[2] The horizontal axis is a log scale in microns so that the 1 to 10 range is in units of 1 and the 10 to 70 range is in tens.

[3] Ppbv stands for parts per billion by volume.

[4] Ppmv stands for parts per million by volume.

AGW Claims vs Truth – 1b timeline of climate alarms

Global Temperatures 2500 BC to 2040 AD
Global Temperatures 2500 BC to 2040 AD (projected) Note: Temperature range is less than plus or minus 2.5oF (1.4oC) from present.

Part 2 of answers to AGW Claim 1. “Global warming and/or climate change are established facts.”  See “Anthropogenic Global Warming vs. Truth – Part 1” blog post for Part 1.


Quote: “Since 1895, the media has alternated between global cooling and warming scares during four separate and sometimes overlapping time periods. From 1895 until the 1930’s the media peddled a coming ice age. From the late 1920’s until the 1960’s they warned of global warming. From the 1950’s until the 1970’s they warned us again of a coming ice age. This makes modern global warming the fourth estate’s fourth attempt to promote opposing climate change fears during the last 100 years.”

— Senator James Inhofe, Monday, September 25, 2006


Here is a more complete timeline straight from the headlines and texts of leading newspapers and other reliable sources, thanks to http://butnowyouknow.net/those-who-fail-to-learn-from-history/climate-change-timeline/ and other reliable documentation as noted below.

  • 1872 John Tyndall measured the heat absorption of various atmospheric gases over the entire wavelength range of his heat source. He found that water vapor and CO2 absorbed more strongly than other atmospheric gases such as oxygen and nitrogen. Oxygen and nitrogen, major components of the atmosphere, had little or no absorption of heat in the range tested. It is important to note that his experiments did not separate the heat into specific wavelengths. See Claim 2 and its chart in the next blog post.

Quote: “…if, as the above experiments indicated, the chief influence be exercised by the aqueous vapour, every variation of this constituent must produce a change of climate. Similar remarks would apply to the carbonic acid [CO2] diffused through the air… they constitute true causes, the extent alone of the operation remaining doubtful.”

              — John Tyndall,                                                                             Contributions to Molecular Physics in the Domain of Radiant Heat, 1872


  • 1895, February, The New York Times: “Geologists Think the World May Be Frozen Up Again”
  • 1899, Nils Eckholm claims that burning coal will double CO2 and cause climate change. Eckholm and Svante Arrhenius claim that it will prevent a predicted coming Ice Age. From Historical Perspectives on Climate Change by James Rodger Fleming, 1998, Oxford University Press.
  • 1902, Los Angeles Times: “Disappearing Glaciers … persistency that means their final annihilation …”
  • 1912, October, The New York Times: “Prof. Schmidt Warns Us of an Encroaching Ice Age”
  • 1923, Chicago Sun-Times: “Scientist says Arctic ice will wipe out Canada”
  • 1923, The Washington Post: “The discoveries of changes in the sun’s heat and southward advance of glaciers … possible advent of a new ice age.”
  • 1924, September, The New York Times: “MacMillan Reports Signs of New Ice Age”
  • 1929, Los Angeles Times: “Is another ice age coming?” “Most geologists think the world is growing warmer, and that it will continue to get warmer.”
  • 1932, The Atlantic magazine, “This Cold, Cold World”
  • 1933, March, The New York Times, “America in Longest Warm Spell Since 1776; Temperature Line Records a 25-Year Rise.”
  • 1933, National Weather Bureau Monthly Weather Review: “…wide-spread and persistent tendency toward warmer weather … Is our climate changing?”
  • 1938, Royal Meteorological Society Quarterly Journal: (Global warming, caused by man heating the planet with carbon dioxide) “is likely to prove beneficial to mankind …”
  • 1938, Chicago Tribune, “Experts puzzle over 20 year mercury rise … mysterious trend toward warmer climate in the last two decades.”
  • 1939, The Washington Post: “… weather men have no doubt that the world at least for the time being is growing warmer.”
  • 1952, August, The New York Times: “… the world has been getting warmer in the last half century.”
  • 1954, U.S. News and World Report: “… winters are getting milder, summers drier. Glaciers are receding, deserts growing.”
  • 1954. Fortune magazine: “Climate – the Heat May Be Off”
  • 1955, Gilbert Plass predicts 3.6o C (6.8o F) warming if CO2 is doubled.

Quote: “ … average surface temperature of the earth increases 3.6o C if the CO2 concentration in the atmosphere is doubled …” (this is the false assumption on which many computer models rest)

Quote: “The extra CO2, released into the atmosphere by industrial processes and other human activities may have caused the temperature rise during the present century. In contrast with other theories of climate, the CO2 theory predicts that this warming trend will continue, at least for several centuries.”

—Gilbert Plass, 1956, “The Carbon Dioxide Theory of Climatic Change.” [1]


  • 1956, October 28, The New York Times: “Warmer Climate on Earth May Be Due To More Carbon Dioxide in the Air,” by Waldemar Kaempffert in The New York Times “Science in Review”
  • 1959, The New York Times: “Arctic Findings in Particular Support Theory of Rising Global Temperatures”
  • 1969, February, The New York Times: “… the Arctic pack ice is thinning and that the ocean at the North Pole may become open sea within a decade or two.”
  • 1970, The Washington Post: “… get a good grip on your long johns, cold weather haters – the worst may be yet to come … there’s no relief in sight.”
  • 1974, Time magazine: “Global cooling for the past forty years”
  • 1974, The Washington Post: “… weather aberrations they are studying may be the harbinger of another ice age.”
  • 1974, Fortune magazine: “As for the present cooling trend a number of leading climatologists have concluded that it is very bad news indeed.”
  • 1974, The New York Times: “… the facts of the present climate change are such that the most optimistic experts would assign near certainty to major crop failure … mass deaths by starvation, and probably anarchy and violence.” (emphasis added)
  • 1975, The New York Times: “Scientists Ponder Why World’s Climate is Changing; A Major Cooling Widely Considered to Be Inevitable”
  • 1975, Nigel Calder, editor of New Scientist in International Wildlife Magazine: “The threat of a new ice age must now stand alongside nuclear war as a likely source of wholesale death and misery for mankind” (emphasis added)
  • 1976, U.S. News and World Report: “Even US farms may be hit by cooling trend”
  • 1981, The New York Times: (Global Warming) “… of an almost unprecedented magnitude”
  • 1988, James Hansen, Goddard Institute for Space Studies, testifies before Congress that global warming is a fact and that consequences of doing nothing will be dire.
  • IPCC, Intergovernmental Panel on Climate Change, was established by the United Nations in that year with the mission to find a connection between human activity and climate change. (emphasis added)
  • After that, the media blitz of articles supporting the belief in global warming or climate change are too numerous to list in detail here.

Quote: “The 1995 IPCC draft report said, ‘Any claims of positive detection of significant climate change are likely to remain controversial until uncertainties in the total natural variability of the climate system are reduced.’ It also said, ‘No study to date has positively attributed all or part of observed climate changes to anthropogenic causes.’ Those statements were removed, and in their place appeared: ‘The balance of evidence suggests a discernable human influence on climate.'”  (emphasis added)

 — “Aliens Cause Global Warming,” Caltech Michelin Lecture, Michael Crichton, 1/17/2003


Quote: “I readily confess a lingering frustration: uncertainties so infuse the issue of climate change that it is still impossible to rule out either mild or catastrophic outcomes, let alone provide confident probabilities for all the claims and counterclaims made about environmental problems. Even the most credible international assessment body, the Intergovernmental Panel on Climate Change (IPCC), has refused to attempt subjective probabilistic estimates of future temperatures. This has forced politicians to make their own guesses about the likelihood of various degrees of global warming.” (emphasis added)

— Stephen Schneider, (warmist camp), former Professor of Environmental Biology and Global Change at Stanford University, in “Global Warming: Neglecting the Complexities,” Scientific American, January 2002, an article requested by the publisher to critique Bjorn Borg’s book The Skeptical Environmentalist


Quote: “On the one hand, as scientists we are ethically bound to the scientific method, in effect promising to tell the truth, the whole truth, and nothing but — which means that we must include all the doubts, the caveats, the ifs, ands, and buts. On the other hand, we are not just scientists but human beings as well. And like most people we’d like to see the world a better place, which in this context translates into our working to reduce the risk of potentially disastrous climatic change.

To do that we need to get some broadbased support, to capture the public’s imagination. That, of course, entails getting loads of media coverage. So we have to offer up scary scenarios, make simplified, dramatic statements, and make little mention of any doubts we might have. This ‘double ethical bind’ we frequently find ourselves in cannot be solved by any formula. Each of us has to decide what the right balance is between being effective and being honest. I hope that means being both.” (emphasis added. Note that the excuse for dishonesty is based on an unsubstantiated assumption that doing so will result in a better world.)

— Stephen Schneider, (warmist camp), former Professor of Environmental Biology and Global Change at Stanford University, in Discover, 1989


[1] Plass, G. N. (1956), “The Carbon Dioxide Theory of Climatic Change.” Johns Hopkins University Press, Tellus, 8: 140–154. doi: 10.1111/j.2153-3490.1956.tb01206.x


Solar Activity, Cosmic Rays, Clouds and Climate


In this YouTube video Henrik Svensmark and colleagues demonstrate the links between Solar Activity and Climate, arising through interaction of the Solar magnetic field and Solar Wind with galactic Cosmic Rays. A weaker field lets more Cosmic Rays through to our atmosphere.  More Cosmic Rays form more ions that nucleate low level clouds. More low level clouds reflect more Solar radiation back into space cooling the planet.

Source:  Watts Up With That at https://wattsupwiththat.com/2013/09/04/svensmarks-cosmic-ray-theory-of-clouds-and-global-warming-looks-to-be-confirmed/