
Deceit
AI Makes Stuff Up
How opposite-think took over our politics — The Wentworth Report
How opposite-think took over our politics. By Patrick West. We live in a time of opposite-think, a topsy-turvy era in which truths become distorted and inverted. Words refer to the reverse of what they once did, and most things are no longer what they seem. Ours is a woke epoch in which women can have…
How opposite-think took over our politics — The Wentworth Report
Fair game in the new America — The Wentworth Report
Fair game in the new America. By Paul Sperry. Democrats are jumping for joy at the prospect of Donald Trump finally getting hooked, like Al Capone, on some kind of — any kind of — criminal charge. But their own political idols — namely, the Clintons or Bidens — could one day be gored by…
Fair game in the new America — The Wentworth Report
Climate Change: What’s Real and What’s Artificial?
Claim 7. Temperatures have risen faster in recent years than ever before.
Truth: Remember that there is no such thing as a global temperature. It is the average of all of the reporting stations all over the world. The rapid rise in temperatures in the 1990s directly coincides with a decrease in the number of Siberian weather stations reporting due to the break-up of the Soviet Union.
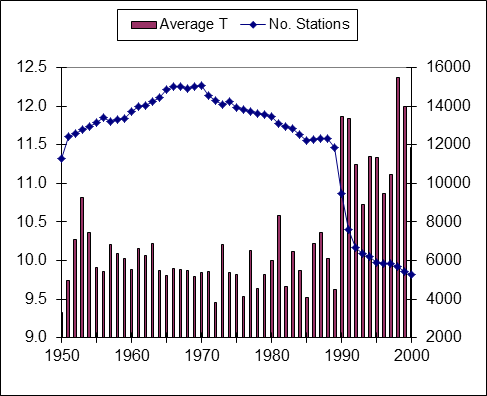
Number of World Reporting Stations & Average Temperatures (vertical bars)
Source: Ross McKitrick, http://www.rossmckitrick.com/
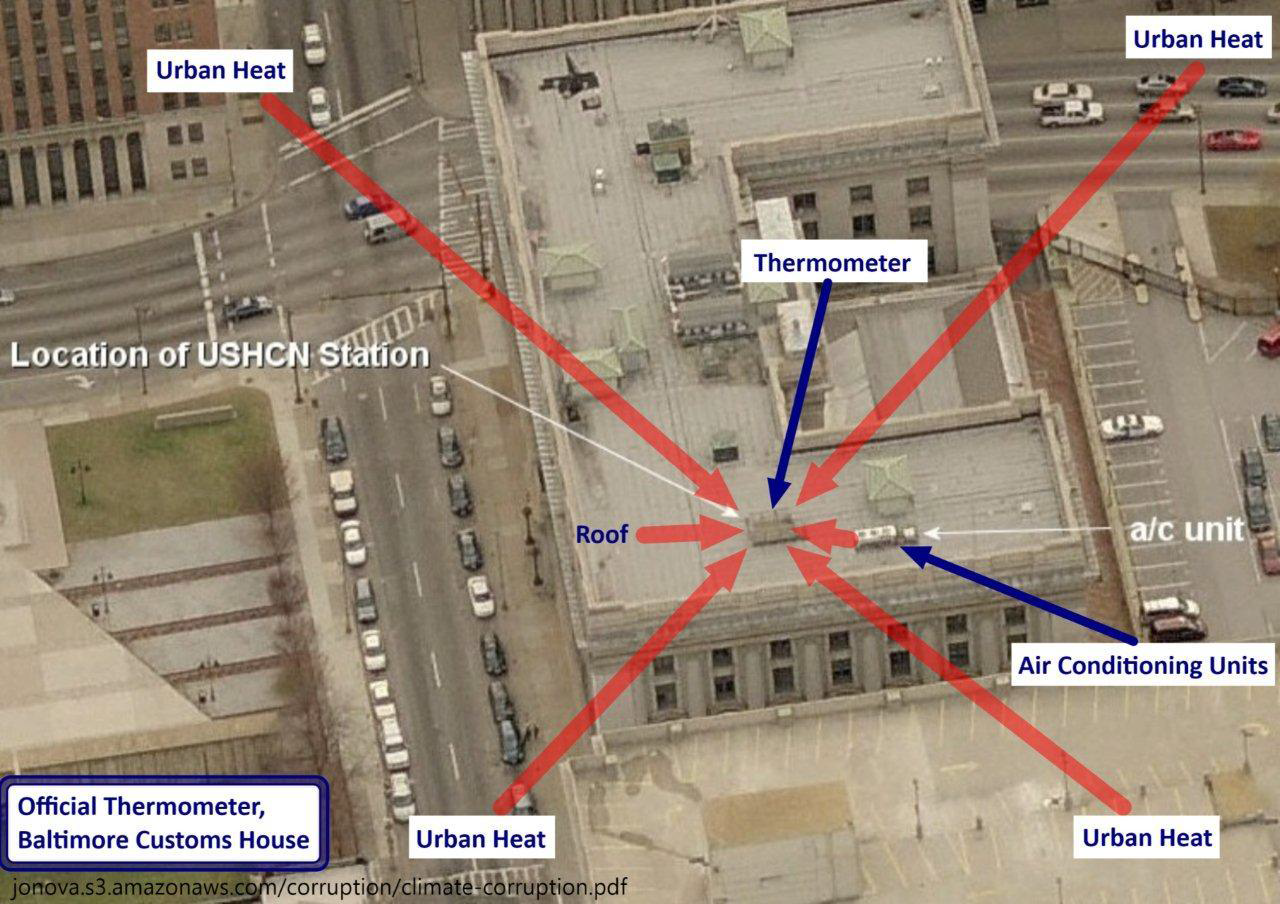
Additionally, the “hottest year on record”, 1998, was an El Nino year so it was naturally hotter than the years just before and after. Another “cause” of rising average global temperatures is the urban heat island effect. Cities are hotter than rural areas. Many of the reporting stations that were once in undeveloped rural areas have experienced either suburban or urban development, or the stations have been moved to more urban settings. It is well documented that some have been, seemingly intentionally, relocated near or at heat sources such as paved parking lots and air conditioners.
One reason for relocation near buildings or other structures could be that new automatic-reporting equipment needs to be connected by cable. Rather than dig up parking lots or roads to install units in a grassy or protected area, many have opted to locate them where they can be directly connected without involving costly excavation, although such sites do not meet the stated requirements. Instead of excluding data from stations that are poorly situated, a convoluted mathematical algorithm (scheme) is used to “correct” it to presumed pre-industrial levels. See illustrations below.
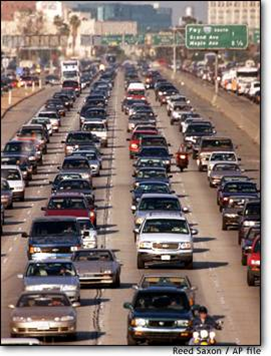
Urban area plus mathematical correction algorithm equals pristine nature
Source: “The Influence of anthropic surface processes and inhomogeneities on gridded global climate data” Slide 21, Powerpoint presentation to the American Chemical Society, Denver CO via Webinar, August 28 2011 by Ross McKitrick, Department of Economics, University of Guelph, Guelph ON Canada http://www.rossmckitrick.com/general-overviews.html
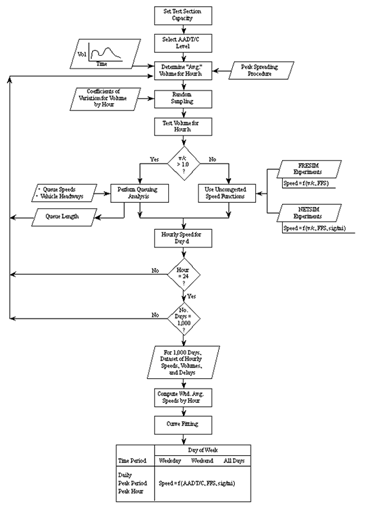
Proposed rating of reporting stations with regard to surroundings:
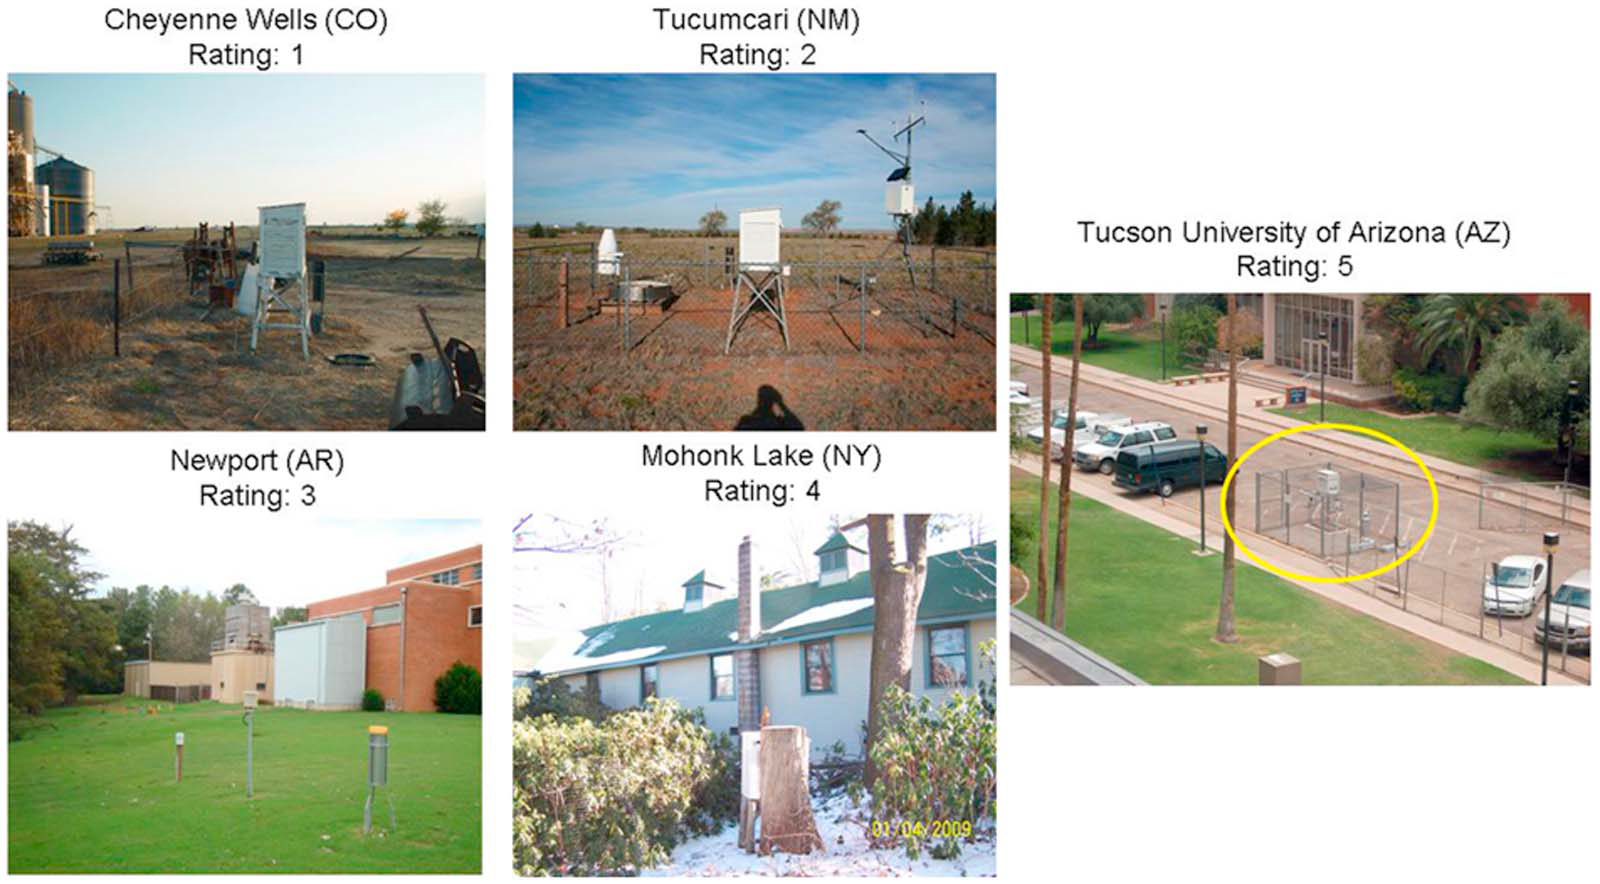
Figure 3. U.S. Historical Climate Network (USHCN) station exposure at sites representative of each CRN class: CRN 1, a clear flat surface with sensors located at least 100 m from artificial heating and vegetation ground cover <10 cm high; CRN 2, same as CRN 1 with surrounding vegetation <25 cm and artificial heating sources within 30 m; CRN 3, same as CRN 2, except no artificial heating sources within 10 m; CRN 4, artificial heating sources <10 m; and CRN 5, sensor located next to/above an artificial heating source.
Source: “Analysis of the impacts of station exposure on the U.S. Historical Climatology Network temperatures and temperature trends,” Souleymane Fall, Anthony Watts, John Nielsen‐Gammon, Evan Jones, Dev Niyogi, John R. Christy,5and Roger A. Pielke Sr., Journal of Geophysical Research, Vol. 116, D116, D14120 doi:10.1029/2010JD015146, 2011
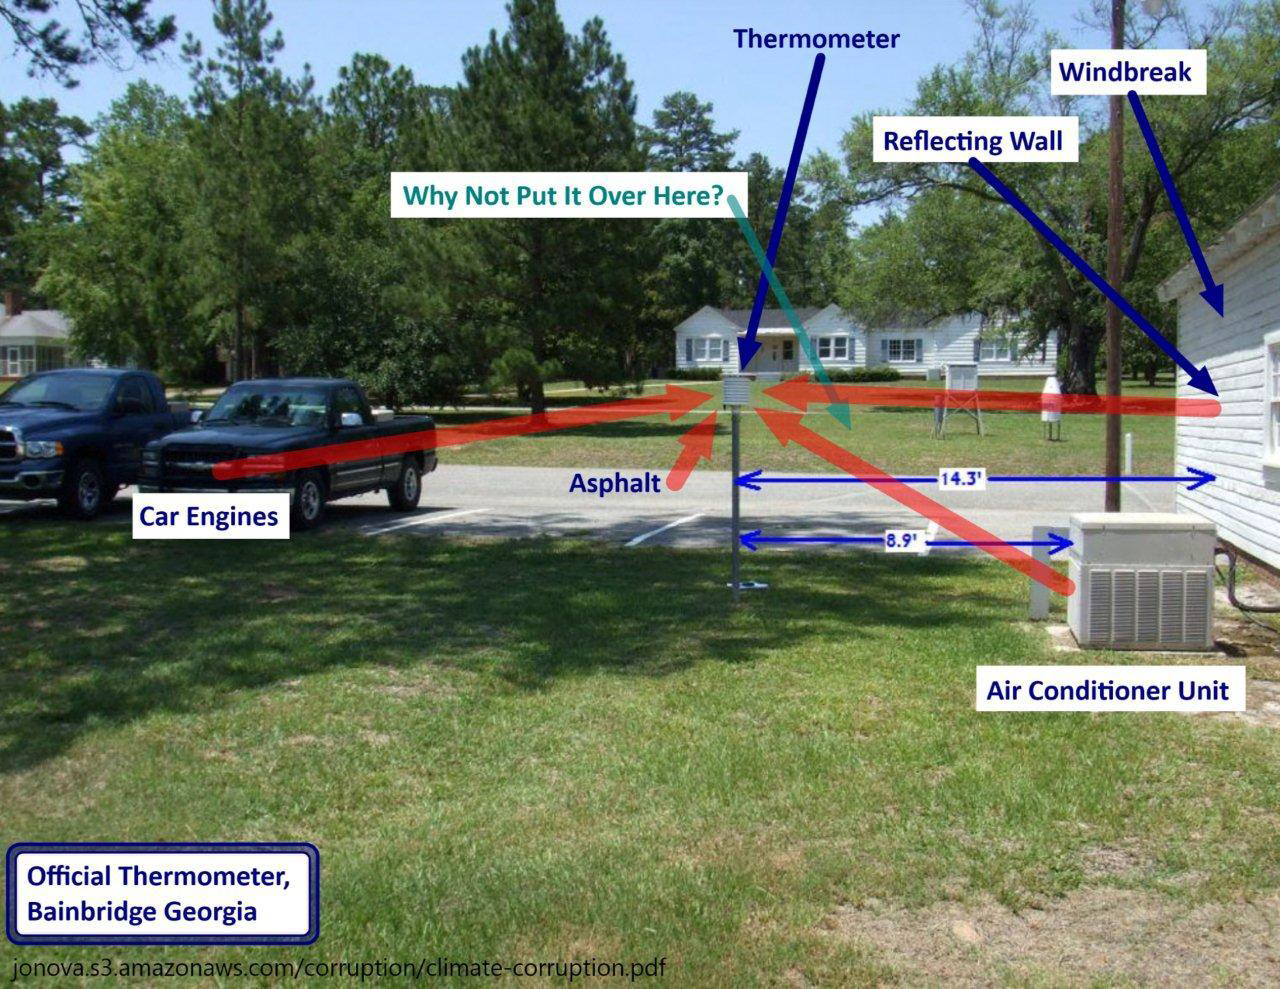
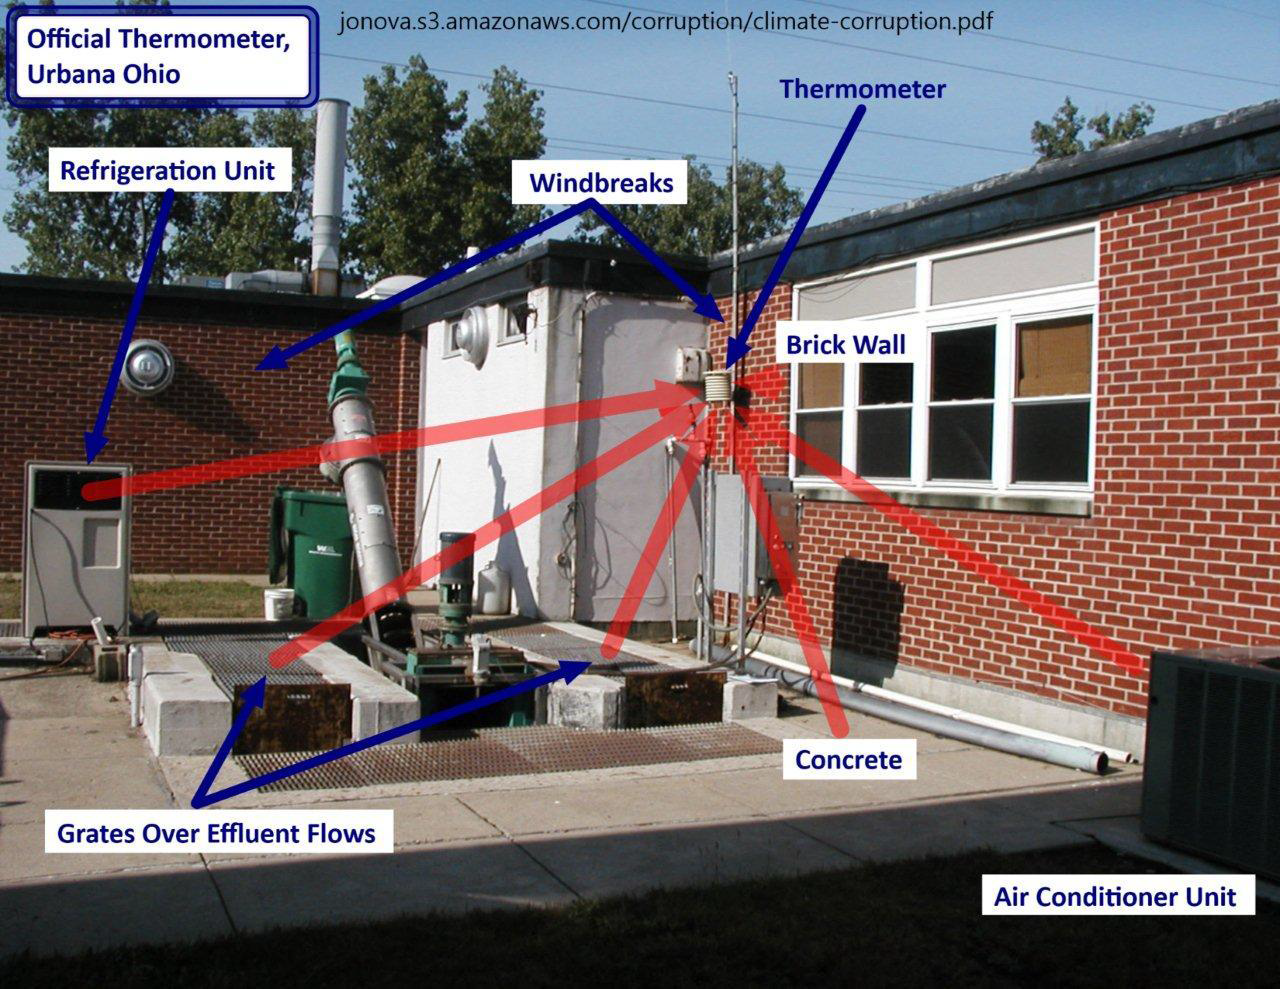
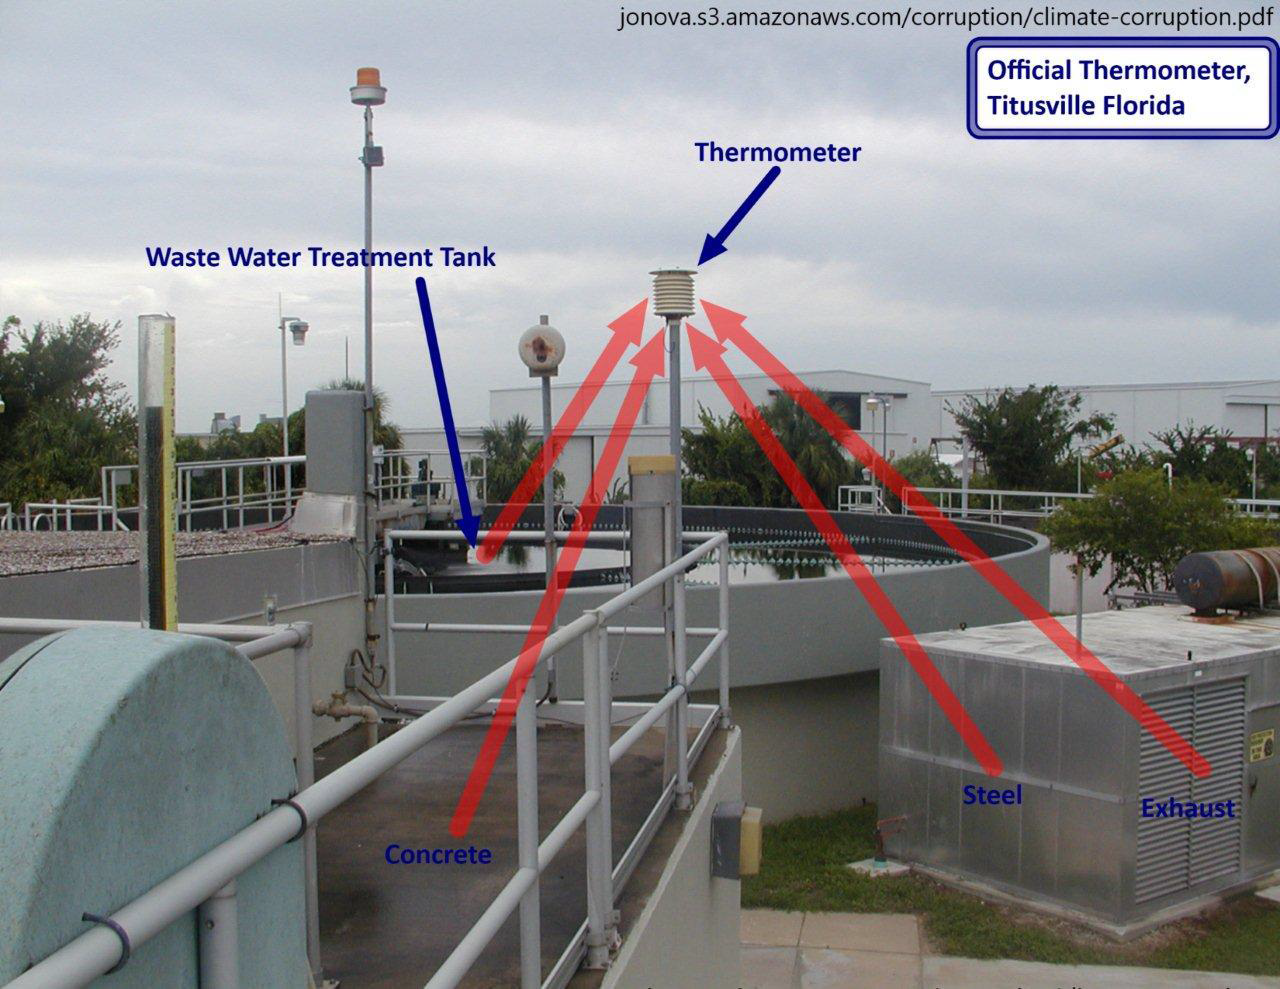
See other examples below of poor placement of temperature reporting stations from “Is the Western Climate Establishment Corrupt?” The public might not understand the science, but they do understand cheating, Dr. David Evans, 11 Nov 2010 (last updated 28 Feb 2011) Web Address: jonova.s3.amazonaws.com/corruption/climate-corruption.pdf
Claim 7 source is book, Perverted Truth Exposed: How Progressive Philosophy has Corrupted Science, 2016
97% of antibiotics are made in China ‘supply chain Armageddon’ — Principia Scientific International
Roughly five months before the Wuhan coronavirus (CoVid-19) reared its ugly head, the U.S.-China Economic and Security Review Commission held a hearing about America’s growing reliance on Chinese pharmaceuticals. And one of the things discussed – or perhaps admitted, depending on how you look at it – is the fact that a shocking 97 percent of all antibiotics…
via 97% of antibiotics are made in China ‘supply chain Armageddon’ — Principia Scientific International
Podcast: Vaccine expert Dr. Paul Offit explains the ‘dos and dont’s’ of battling scientific misinformation — Genetic Literacy Project

Climate Change: What’s Real and What’s Artificial? Reposted
. . . One “cause” of rising average global temperatures is the urban heat island effect. Cities are hotter than rural areas. Many of the reporting stations that were once in undeveloped rural areas have experienced either suburban or urban development, or the stations have been moved to more urban settings. It is well documented that some have been, seemingly intentionally, relocated near or at heat sources such as paved parking lots and air conditioners.
One reason for relocation near buildings or other structures could be that new automatic-reporting equipment needs to be connected by cable. Rather than dig up parking lots or roads to install units in a grassy or protected area, many have opted to locate them where they can be directly connected without involving costly excavation, although such sites do not meet the stated requirements. Instead of excluding data from stations that are poorly situated, a convoluted mathematical algorithm (scheme) is used to “correct” it to presumed pre-industrial levels. See illustrations below.
One additional problem with the newer sensors is their fast response. Since they record the high and low temperature point each day, not the average, they can report a transient heat source like a passing bus, an idling auto or jet engine exhaust at the airport instead of the actual ambient temperature.
Urban area plus mathematical correction algorithm equals pristine nature
Source: “The Influence of anthropic surface processes and inhomogeneities on gridded global climate data” Slide 21, Powerpoint presentation to the American Chemical Society, Denver CO via Webinar, August 28 2011 by Ross McKitrick, Department of Economics, University of Guelph, Guelph ON Canada http://www.rossmckitrick.com/general-overviews.html
Proposed rating of reporting stations with regard to surroundings:
Figure 3. U.S. Historical Climate Network (USHCN) station exposure at sites representative of each CRN class: CRN 1, a clear flat surface with sensors located at least 100 m from artificial heating and vegetation ground cover <10 cm high; CRN 2, same as CRN 1 with surrounding vegetation <25 cm and artificial heating sources within 30 m; CRN 3, same as CRN 2, except no artificial heating sources within 10 m; CRN 4, artificial heating sources <10 m; and CRN 5, sensor located next to/above an artificial heating source.
Source: “Analysis of the impacts of station exposure on the U.S. Historical Climatology Network temperatures and temperature trends,” Souleymane Fall, Anthony Watts, John Nielsen‐Gammon, Evan Jones, Dev Niyogi, John R. Christy,5and Roger A. Pielke Sr., Journal of Geophysical Research, Vol. 116, D116, D14120 doi:10.1029/2010JD015146, 2011
See other examples below of poor placement of temperature reporting stations from “Is the Western Climate Establishment Corrupt?” The public might not understand the science, but they do understand cheating, Dr. David Evans, 11 Nov 2010 (last updated 28 Feb 2011) Web Address: jonova.s3.amazonaws.com/corruption/climate-corruption.pdf
Half-Baked Hoax: Claims For All Wind & Solar Powered Future Are Pure Fantasy — STOP THESE THINGS

No country has ever powered itself entirely with wind and solar. No country ever will. The image above is not the crazed doodlings of a maniac, it’s the combined output of every wind turbine connected to Australia’s Eastern Grid last month thanks to Aneroid Energy. Note the numerous occasions when output plummets by 2-3,000MW in minutes, […]
via Half-Baked Hoax: Claims For All Wind & Solar Powered Future Are Pure Fantasy — STOP THESE THINGS
Why CO2 is not the cause of climate change
Does Carbon Dioxide cause climate change?
Carbon dioxide is a minor player in any further warming. It is uniformly distributed in the atmosphere but only absorbs infrared (heat) in a very narrow wavelength range. The CO2 wavelength range is outside the range of most of the solar radiance that penetrates our atmosphere. It falls roughly inside the wavelength range of temperatures re-radiated when solar radiation heats the earth’s surface. The atmospheric CO2 already absorbs almost all of the radiation that it can in that range. Most of the warming effect of CO2 has already occurred in the past and is one of the reasons our planet is not a frozen wasteland. Any increase in CO2 will have a very minor effect. With CO2 absorption near saturation, almost all of the re-radiated heat in that wavelength range is already being trapped, so it can have little or no effect on future increases in temperature or supposed forcing of water vapor. With CO2 essentially eliminated as a source, any increases in temperature must be from some other source.
![]()
Source: This figure was created by Robert A. Rohde from published data and is part of the Global Warming Art project. The image is on Wikipedia at https://en.wikipedia.org/wiki/User:Dragons_flight/Images#/media/File:Atmospheric_Transmission.png
This figure requires a bit of explaining. The top spectrum shows the wavelengths at which the atmosphere transmits light and heat as well as the “black body” idealized curves for no absorption. It is a little misleading because the data is not based on actual solar and earth data. It is based on two experimental heat sources, one centered at 5525 K (5252o C or 9485o F), the approximate temperature of solar radiation, and one centered in the range of 210 to 310 K (-63o C to 36.8o C or -82oF to 98o F), the approximate temperature range of re-radiated heat from the earth. In reality solar radiation power, (Watts/m2/micron), shown in red, is six million times as strong as the power of re-radiated heat from the earth, shown in blue.
The other spectra are absorption[1] spectra. The top one shows the relative percent absorption by total atmospheric gases at various wavelengths, (note that this spectrum is practically the inverse of the transmission spectrum above it), and the spectra below that show the absorption wavelength ranges of individual atmospheric gases, but not the relative strength of that absorption in reality. As experimental, not real atmospheric, data they can only tell us the wavelength ranges of the absorption, not their relative strengths.
Note that CO2 absorbs in the 15 micron range[2], which is within both the range of re-radiated heat and the strong absorption by water vapor, of which the CO2 peak forms a mere shoulder. This is used to claim forcing of water vapor by CO2, without regard to the near-saturation level of CO2. Lesser CO2 peaks in the 2.7 and 4.3 micron ranges also only contribute in a minor way, the first is completely covered by a water vapor absorption peak and the second forms a shoulder in another water vapor peak. These minor peaks occur in a region where both solar radiation and re-radiation are minimized. Methane and nitrous oxide are also shown to be minor players, having narrow absorption ranges and low concentrations. Note too that ozone blocks most of the ultraviolet light from the sun.
Water is by far the most important greenhouse gas/liquid in the form of vapor, high and low altitude clouds, rain and snow, which both absorb and reflect sunlight and re-radiated heat from the surface. Water vapor is not uniformly distributed in the atmosphere, being concentrated near the earth, but strongly absorbs heat in a wide range of wavelengths. More heat means more water vapor evaporating from the oceans. Sounds pretty scary, doesn’t it? Contrary to what is assumed by climate modelers, who use this to claim forcing by CO2, the extra vapor doesn’t remain as vapor. It quickly forms low altitude clouds that strongly reflect in-coming sunlight and heat into space. Any re-radiated heat from the surface that may be trapped by clouds is a small fraction compared to the in-coming solar radiation, so blocking solar radiance has a net cooling effect that overwhelms any increases in trapped re-radiation. High altitude clouds tend to trap heat from being re-radiated into space, but have little effect because the increases in cloud cover due to warming are mostly in low altitude clouds.
[1] Transmission and Absorption are inversely related by the formula A = 1/log T.
[2] The horizontal axis is a log scale in microns so that the 1 to 10 range is in units of 1 and the 10 to 70 range is in tens.
NOTE: Republished from July 22, 2015 Post (media link broken and here restored)
 Want to know more about this and other Modern Myths including climate change, evolution, origin of life, Big Bang cosmology or quantum physics? See related posts on this website or buy the book Perverted Truth Exposed: How Progressive Philosophy Has Corrupted Science on line at Amazon, Books-a-Million or Barnes & Noble .
