Great Balls of Fire: More Terrifying Turbine Meltdowns Spell Serious & Unnecessary Bushfire Risk

Bush fire hazard from burning wind turbine oils and combustible components is a real problem.

STOP THESE THINGS

As Australians brace for a searing summer, spare a thought for communities riddled with wind turbines: the perfect incendiary device.

First, we’ll take a look at a few ‘clean’-energy conflagrations in Europe.

Fire destroys wind turbine in the Emsland
New Osnabrück
Daniel Gonzalez-Tepper and Hermann Hinrichs
14 October 2018

Rhede. In the wind energy park in Rhede, a wind turbine is completely burned down by a fire in a power house. The operating company Windpark Rhede GmbH & Co. KG assumes that the resulting property damage could amount to up to 1.5 million euros. The fire department brought the fire equal to three missions.

According to the police, the fire broke out in the wind farm on Q-way in the northwest of the community at 3 clock on Friday morning. The fire had broken out in or at a machine house and had then spread to the entire plant. As…

View original post 982 more words

Global Temperatures Rose As Cloud Cover Fell In the 1980s and 90s

NOT A LOT OF PEOPLE KNOW THAT

By Paul Homewood

We’ve been discussing the sudden rise in UK and European temperatures in the 1990s, and I was reminded about a study undertaken by Clive Best and Euan Mearns looking at the role of cloud cover four years ago:

image

Clouds have a net average cooling effect on the earth’s climate. Climate models assume that changes in cloud cover are a feedback response to CO2 warming. Is this assumption valid? Following a study with Euan Mearns showing a strong correlation in UK temperatures with clouds, we looked at the global effects of clouds by developing a combined cloud and CO2 forcing model to sudy how variations in both cloud cover [8] and CO2 [14] data affect global temperature anomalies between 1983 and 2008. The model as described below gives a good fit to HADCRUT4 data with a Transient Climate Response (TCR )= 1.6±0.3°C. The 17-year hiatus in…

View original post 290 more words

MUST READ : Corrupted UN Must Never Be Allowed To Lecture Us — Climatism

“We’ve got to ride this global warming issue. Even if the theory of global warming is wrong, we will be doing the right thing in terms of economic and environmental policy.“ – Timothy Wirth, President of the UN Foundation “Isn’t the only hope for the planet that the industrialized civilizations collapse? Isn’t it our responsibility to bring that about?” […]

via MUST READ : Corrupted UN Must Never Be Allowed To Lecture Us — Climatism

India Rumbles Wind Power as Fake Electricity: Output Collapses During Dead-Calm Monsoon

STOP THESE THINGS

The spinning wheel was meant to signify Indian independence, too.

It never takes them long to work out that wind power is the greatest economic and environmental fraud of all time. Eco-zealots have attempted to ram wind and solar power down the throats of Third World governments under the auspices of saving the planet and purportedly with the purpose of dragging millions out of poverty. As the initiated well-know, wind power rates zero on both scores. Pointless and expensive, wind power is a kind of first world disease being spread by UN endorsed lunatics, across the developing world.

In India, solar power is seen as ‘fake electricity’, by those being forced to use it: The Cruel Hypocrisy: West Drops Wind Power as it Forces ‘Fake Electricity’ on the World’s Poor

Now, Indians have branded wind power an outright fraud, too. The calm, and very wet weather that comes with the monsoon…

View original post 1,219 more words

Mr Procter Goes To Drax

NOT A LOT OF PEOPLE KNOW THAT

By Paul Homewood

One of our readers received this circular from his local Tory MEP.

It included news of his visit to Drax:

image

image

Highly amused at Mr Procter’s rather naive acceptance of what the spin merchants at Drax had told him, he fired off this letter to the MEP:

And then got this in reply:

In other words, I know it’s all nonsense, but it is the government’s policy, so I’ve got to go along with it!

No doubt, Mr Procter would applaud Matt’s “pioneering” technology if the government told him to!

image

View original post

Why and How the IPCC Demonized CO2 with Manufactured Information — Watts Up With That?

Guest essay by Dr. Tim Ball

Elaine Dewar spent several days with Maurice Strong at the UN and concluded in her book The Cloak of Green that, “Strong was using the U.N. as a platform to sell a global environment crisis and the Global Governance Agenda.” Strong conjectured about a small group of world leaders […]

via Why and How the IPCC Demonized CO2 with Manufactured Information — Watts Up With That?

Why CO2 is not the cause of climate change

Does Carbon Dioxide cause climate change?

a) Carbon dioxide is a minor player in any further warming. It is uniformly distributed in the atmosphere but only absorbs infrared (heat) in a very narrow wavelength range. The CO2 wavelength range is outside the range of most of the solar radiance that penetrates our atmosphere. It falls roughly inside the wavelength range of temperatures re-radiated when solar radiation heats the earth’s surface. The atmospheric CO2 already absorbs almost all of the radiation that it can in that range. Most of the warming effect of CO2 has already occurred in the past and is one of the reasons our planet is not a frozen wasteland. Any increase in CO2 will have a very minor effect. With CO2 absorption near saturation, almost all of the re-radiated heat in that wavelength range is already being trapped, so it can have little or no effect on future increases in temperature or supposed forcing of water vapor. With CO2 essentially eliminated as a source, any increases in temperature must be from some other sources.

Absorption of gases – note narrow CO2 bands & broad water bands.

http://www.globalwarmingart.com/wiki/File:Atmospheric_Transmission_png

Source: Robert A. Rohde (Dragons flight at English Wikipedia) – This figure was created by Robert A. Rohde from published data and is part of the Global Warming Art project. http://www.atmo.arizona.edu/stud

This figure requires a bit of explaining. The top spectrum shows the wavelengths at which the atmosphere transmits light and heat as well as the “black body” idealized curves for no absorption. It is a little misleading because the data is not based on actual solar and earth data. It is based on two experimental heat sources, one centered at 5525 K (5252o C or 9485o F), the approximate temperature of solar radiation, and one centered in the range of 210 to 310 K (-63o C to 36.8o C or -82oF to 98o F), the approximate temperature range of re-radiated heat from the earth. In reality solar radiation power, (Watts/m2/micron), shown in red, is six million times as strong as the power of re-radiated heat from the earth, shown in blue.

The other spectra are absorption[1] spectra. The top one shows the relative percent absorption by total atmospheric gases at various wavelengths, (note that this spectrum is practically the inverse of the transmission spectrum above it), and the spectra below that show the absorption wavelength ranges of individual atmospheric gases, but not the relative strength of that absorption in reality. As experimental, not real atmospheric, data they can only tell us the wavelength ranges of the absorption, not their relative strengths.

Note that CO2 absorbs in the 15 micron range[2], which is within both the range of re-radiated heat and the strong absorption by water vapor of which the CO2 peak forms a mere shoulder. This is used to claim forcing of water vapor by CO2, without regard to the near-saturation level of CO2. Lesser CO2 peaks in the 2.7 and 4.3 micron ranges also only contribute in a minor way, the first is completely covered by a water vapor absorption peak and the second forms a shoulder in another water vapor peak. These minor peaks occur in a region where both solar radiation and re-radiation are minimized. Methane and nitrous oxide are also shown to be minor players, having narrow absorption ranges and low concentrations. Note too that ozone blocks most of the ultraviolet light from the sun.

b.) Water is by far the most important greenhouse gas/liquid in the form of vapor, high and low altitude clouds, rain and snow, which both absorb and reflect sunlight and re-radiated heat from the surface. Water vapor is not uniformly distributed in the atmosphere, being concentrated near the earth, but strongly absorbs heat in a wide range of wavelengths. More heat means more water vapor evaporating from the oceans. Sounds pretty scary, doesn’t it? Contrary to what is assumed by climate modelers, who use this to claim forcing by CO2, the extra vapor doesn’t remain as vapor. It quickly forms low altitude clouds that strongly reflect in-coming sunlight and heat into space. Any re-radiated heat from the surface that may be trapped by clouds is a small fraction compared to the in-coming solar radiation, so blocking solar radiance has a net cooling effect that overwhelms any increases in trapped re-radiation. High altitude clouds tend to trap heat from being re-radiated into space, but have little effect because the increases in cloud cover due to warming are mostly in low altitude clouds.

[1] Transmission and Absorption are inversely related by the formula A = 1/log T.

[2] The horizontal axis is a log scale in microns so that the 1 to 10 range is in units of 1 and the 10 to 70 range is in tens.

NOTE: Republished from July 22, 2015 Post (media link broken and here restored)


Want to know more about this and other Modern Myths including climate change, evolution, origin of life, Big Bang cosmology or quantum physics? See related posts on this website or buy the book Perverted Truth Exposed: How Progressive Philosophy Has Corrupted Science in print or as e-book/Kindle on line at WND Superstore (the publisher) or at Amazon, Books-a-Million or Barnes & Noble .

Carbon Dioxide is plant food and increases growth rates

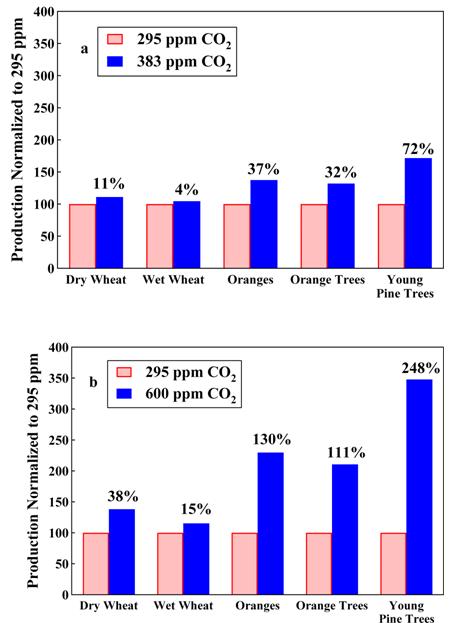
Animals exhale Carbon Dioxide (CO2) and breathe Oxygen (O2), while plants use CO2 and exhale O2. Professional greenhouses often add extra CO2 to increase growth rates. Increased plant growth removes much of the CO2 released into the atmosphere. Between pre-industrial and present times, studies show an average of 15% increase in plant growth rates, with some species increased many times that, e.g. young pine trees. Increased plant growth rates and wider distribution of arable (farmable) land due to warming as well as improved farming practices can solve the so-called overpopulation problem. If much of the data used in the climate models are based on proxy data from tree rings, and growth has been increased by CO2, does that mean that the data is artificially skewed toward “warmer” results? Hmmm.

Plant Growth Chart 1.png


Figure 1. Comparison of Plant Growth at Pre-industrial CO2 levels (295 ppm in pink), at 383 ppm and 600 ppm (in blue) in Dry Wheat, Wet Wheat, Oranges, Orange Trees and Young Pine Trees. Note Percent increases.
Source: Review Article: “Environmental effects of increased atmospheric carbon dioxide,” Willie Soon (1), Sallie L. Baliunas(1), Arthur B. Robinson (2), Zachary W.Robinson (2) Climate Research. 13, 149-164, (1999)  Affiliations: (1) Harvard-Smithsonian Center for Astrophysics, 60 Garden Street, Cambridge, Massachusetts 02138; (2) Oregon Institute of Science and Medicine, 2251 Dick George Road, Cave Junction, Oregon 97523

A. Critics created the “progressive nitrogen limitation hypothesis,” which assumes that increased growth rates of trees would deplete poor soils of nitrogen, thus mediating the positive effects of increased CO2. This is a scenario based on theory, not reality, which stubbornly refuses to support the hypothesis. Many studies[1] show that, contrary to the hypothesis, although roots grow deeper and produce more fine hairs, soil and forest floor are enriched in nitrogen from biological sources, i.e. increased root mass and leaf litter supporting beneficial microbes in the soil.

B. One benefit of increased CO2 is that the stomata (openings) of leaves, which take in CO2 and emit water vapor and oxygen, are reduced, leading to less water loss, enhanced water use and improved tolerance to dryer conditions. At elevated CO2 levels, stomata do not need to be open as far to allow sufficient CO2 in for photosynthesis and, as a result, less water is lost through transpiration[2]. In controlled studies, an additional benefit of reduced stomata openings is a reduction of ozone damage.

C. The increased rate of growth of plants, from forests to sea algae, results in more of certain cooling aerosols being produced. These include Carbonyl Sulfide (COS) from soil and seas that become highly reflective sulfate in the stratosphere to reflect more solar radiation back into space, Iodo-compounds from sea algae that nucleate clouds to reflect more solar radiation back into space, dimethyl sulfide (DMS), from seas that nucleates clouds and other aerosols such as isoprene from trees with similar effects.

D.  Hormesis is a phenomenon, commonly seen in medicine and nutrition, where a low concentration or dose results in a positive effect, but a larger dose results in damage. For instance, some salt and water are necessary to good health, but beyond a certain point, ingesting more can be harmful or fatal. The effect of CO2 on plant life appears to be one such system. Increased CO2 obviously benefits plant life, but it is uncertain at what level CO2 might have a detrimental effect on growth. In professional greenhouses and experiments, even ten times the current level is still beneficial.

Hormesis Chart 1

Figure 2.  Illustration of how Carbon Dioxide is beneficial to plants through Hormesis. Horizontal Axis is Increasing CO2 level.

Source: http://www.drroyspencer.com/Earth’s Response to Increasing CO2: An Example of Hormesis? August 11th, 2014

As a matter of fact, CO2 below 400 ppm restricts growth, and below 150 ppm plants die en masse.  For a good summary of this, see post at http://notrickszone.com/2013/05/17/atmospheric-co2-concentrations-at-400-ppm-are-still-dangerously-low-for-life-on-earth/ by posted on 17. May 2013 :   Atmospheric CO2 Concentrations At 400 PPM Are Still Dangerously Low For Life On Earth 

[1] Example: Phillips, R.P., Finzi, A.C. and Bernhardt, E.S. 2011. “Enhanced root exudation induces microbial feedbacks to N cycling in a pine forest under long-term CO2 fumigation”. Ecology Letters 14: 187-194.

[2] See review article of research papers: “Responses of agricultural crops to free-air CO2 enrichment” Kimball, B.A., Kobayashi, K. and Bindi, M., Advances in Agronomy 77: 293-368 2002.

This article was first published in August, 2015. Some revisions/links have been added. Information is from my book Perverted Truth Exposed: How Progressive Philosophy has Corrupted Science, published June 2016, available online from Amazon.com

BBC censorship and the man-made global warming scam

NOT A LOT OF PEOPLE KNOW THAT

By Paul Homewood

A brilliantly incisive article from Melanie Phillips:

melaniephillips.com

BBC censorship and the man-made global warming scam


It’s only fair to share…

This evening, an important lectureis being delivered in London on the subject of man-made or anthropogenic global warming (AGW) theory.

If you follow BBC news programmes, you are extremely unlikely to hear anything about this important lecture.

That is because the scientist delivering it is saying that man-made global warming theory is a scam.

BBC policy is to report no challenge to AGW theory at all. The explicit statement of this policy was set out in a four-page memo by Fran Unsworth, the BBC’s Director of News and Current Affairs, which was leaked to Carbon Brieflast month.

This memo maintained that man-made climate change “exists” and no-one proposing the contrary view – offensively termed a “denier” – was needed to balance the debate. “To achieve…

View original post 1,140 more words

Dirty Rotten Scoundrels: American Wind Industry Caught Faking Community ‘Support’ for Wind Power

All politics, all the time – and thousands of dead birds and bats – and ruined rural serenity and sleep.

STOP THESE THINGS

The wind industry was founded on myth, is built on lies and runs on a mix of subsidies and propaganda.

And, it should never be forgotten that, the greatest economic and environmental fraud of all time, was only made possible by our political betters.

Armed with the belief (not unjustified) that you can fool most of the people, most of the time, politicians run the same nonsensical lines as the rent-seekers, who critically depend upon them for endless subsidies, mandated targets, tax credits, soft loans and corrupt planning rules and regulations. It’s a match made in heaven.

Then there’s the need to pretend that wind power has broad and lasting community support.

In its efforts to ‘win hearts and minds’ in increasingly switched-on and cynical rural communities, the wind industry is utterly shameless.

Sham surveys, phoney consultations and barefaced lying are all par for the course.

Struggling to conjure up…

View original post 1,294 more words