Nine Elements Shared by Climate and Covid — Science Matters

Two Sides of the Same Coin Ramesh Thakur writes at Brownstone Institute Beware Catastrophizing Climate Models and Activists.  Excerpts in italics with my bolds and added images. All true believers of The Science™ of climate change have taken careful note of the lessons offered by the coronavirus pandemic during 2020–22 for managing the ‘climate emergency.’ […]

Nine Elements Shared by Climate and Covid — Science Matters

Fair game in the new America — The Wentworth Report

Fair game in the new America. By Paul Sperry. Democrats are jumping for joy at the prospect of Donald Trump finally getting hooked, like Al Capone, on some kind of — any kind of — criminal charge. But their own political idols — namely, the Clintons or Bidens — could one day be gored by…

Fair game in the new America — The Wentworth Report

Bill Ponton’s “Reality Check” On UK Wind Power: The Issue of Energy Storage — Watts Up With That?

The only question is how disastrous the crash will be when it all falls apart.

Bill Ponton’s “Reality Check” On UK Wind Power: The Issue of Energy Storage — Watts Up With That?

Wholesale Environmental & Economic Disaster: Why Wind Power Fails on Every Count — STOP THESE THINGS

On any reckoning, wind power is an abject failure. Dilute and diffuse, chaotically intermittent, insanely costly (when backup costs are included) and a wholesale environmental disaster, wiping out millions of birds, bats and beneficial bugs, and wrecking the livability the rural communities, nothing stacks up apart from the massive and endless subsidies upon which the […]

Wholesale Environmental & Economic Disaster: Why Wind Power Fails on Every Count — STOP THESE THINGS

Shining Light on Science Education’s Dark Age — Watts Up With That?

Possibly even worse than the promotion of “consensus” was their endorsement of censorship of any scientific information that deviates from the consensus groupthink.

Shining Light on Science Education’s Dark Age — Watts Up With That?

Media Regurgitates IPCC’s ‘Final Warning’ on Climate Change – Without Realizing We’ve Already Passed 1.5°C — Watts Up With That?

With all this contrary evidence of a doom-laden present and future, isn’t it time we simply stop listening to these unproven claims?

Media Regurgitates IPCC’s ‘Final Warning’ on Climate Change – Without Realizing We’ve Already Passed 1.5°C — Watts Up With That?

Deforesting To Save The Planet? Europe’s Forests Shrinking as Wood Used For “Green” Energy — Watts Up With That?

In the United Kingdom, the former Drax coal-fired power plant burns significant amounts of wood.

Deforesting To Save The Planet? Europe’s Forests Shrinking as Wood Used For “Green” Energy — Watts Up With That?

Prominent physicist warns that wind power “fails on every count” — NOT A LOT OF PEOPLE KNOW THAT

By Paul Homewood I thoroughly recommend reading this report. It is only three pages long and is succinct:     London, 23 March – A prominent physicist has warned that the UK is facing the likelihood of a failure in the electricity supply and calls for a reset of national energy policy. Professor Wade Allison, […]

Prominent physicist warns that wind power “fails on every count” — NOT A LOT OF PEOPLE KNOW THAT

Urban Heat Effect – re-post from 2016

Source: Perverted Truth Exposed: How Progressive Philosophy has Corrupted Science, by Kay Kiser, published 2016, Chapter 15: Climate Change, Philosophy Disguised as Science

Claim 7. Temperatures have risen faster in recent years than ever before.

Truth: Remember that there is no such thing as a global temperature. It is the average of all of the reporting stations all over the world. The rapid rise in temperatures in the 1990s directly coincides with a decrease in the number of Siberian weather stations reporting due to the break-up of the Soviet Union.

 082015_1920_1.png

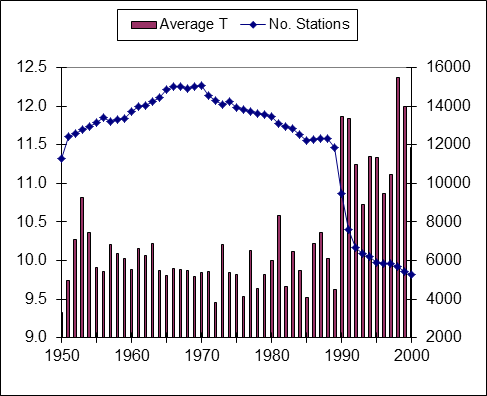
Number of World Reporting Stations & Average Temperatures (vertical bars)

Source: Ross McKitrick, http://www.rossmckitrick.com/

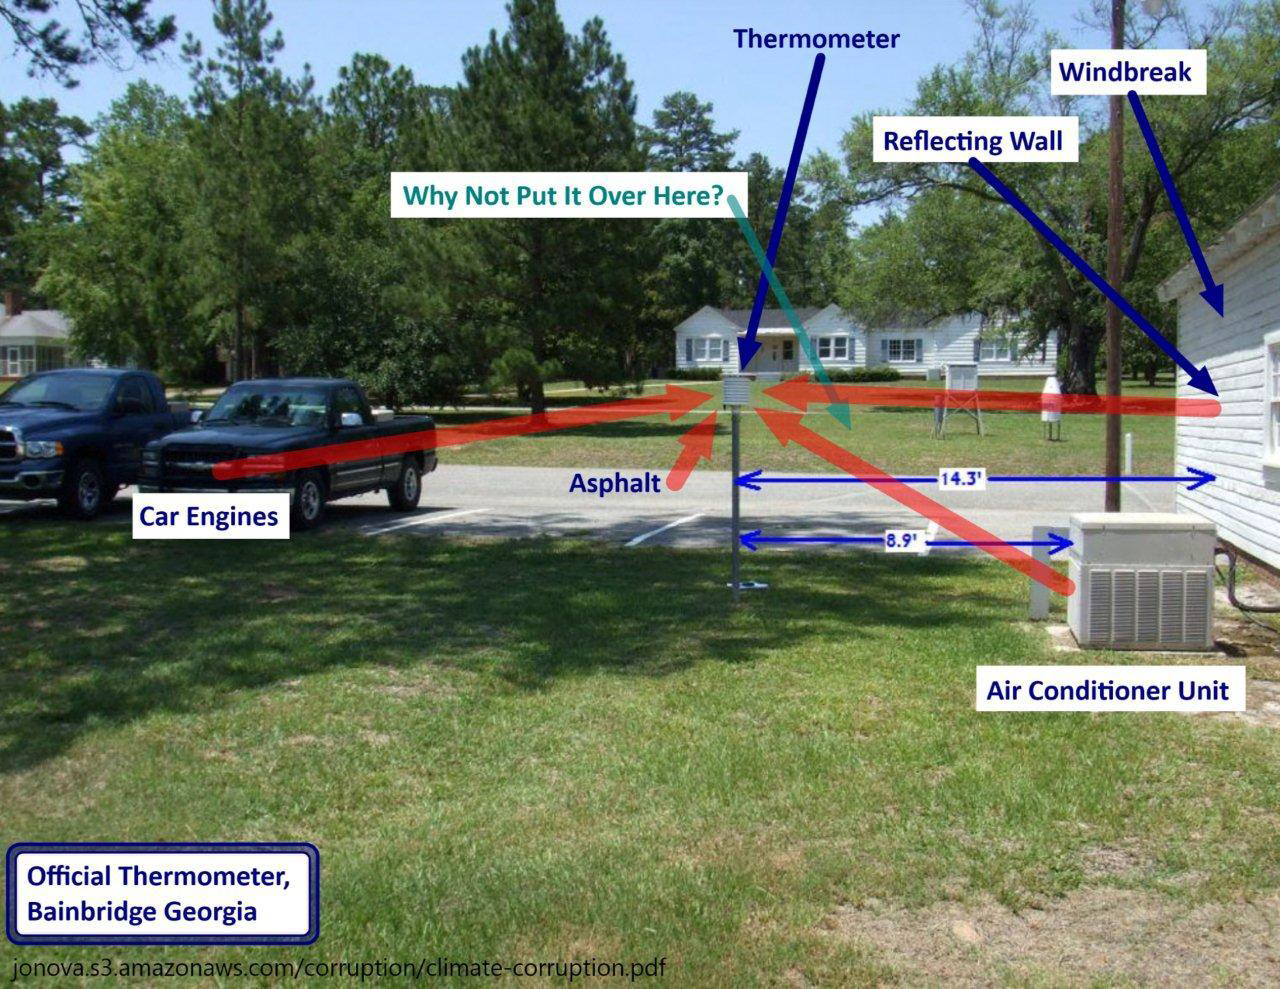
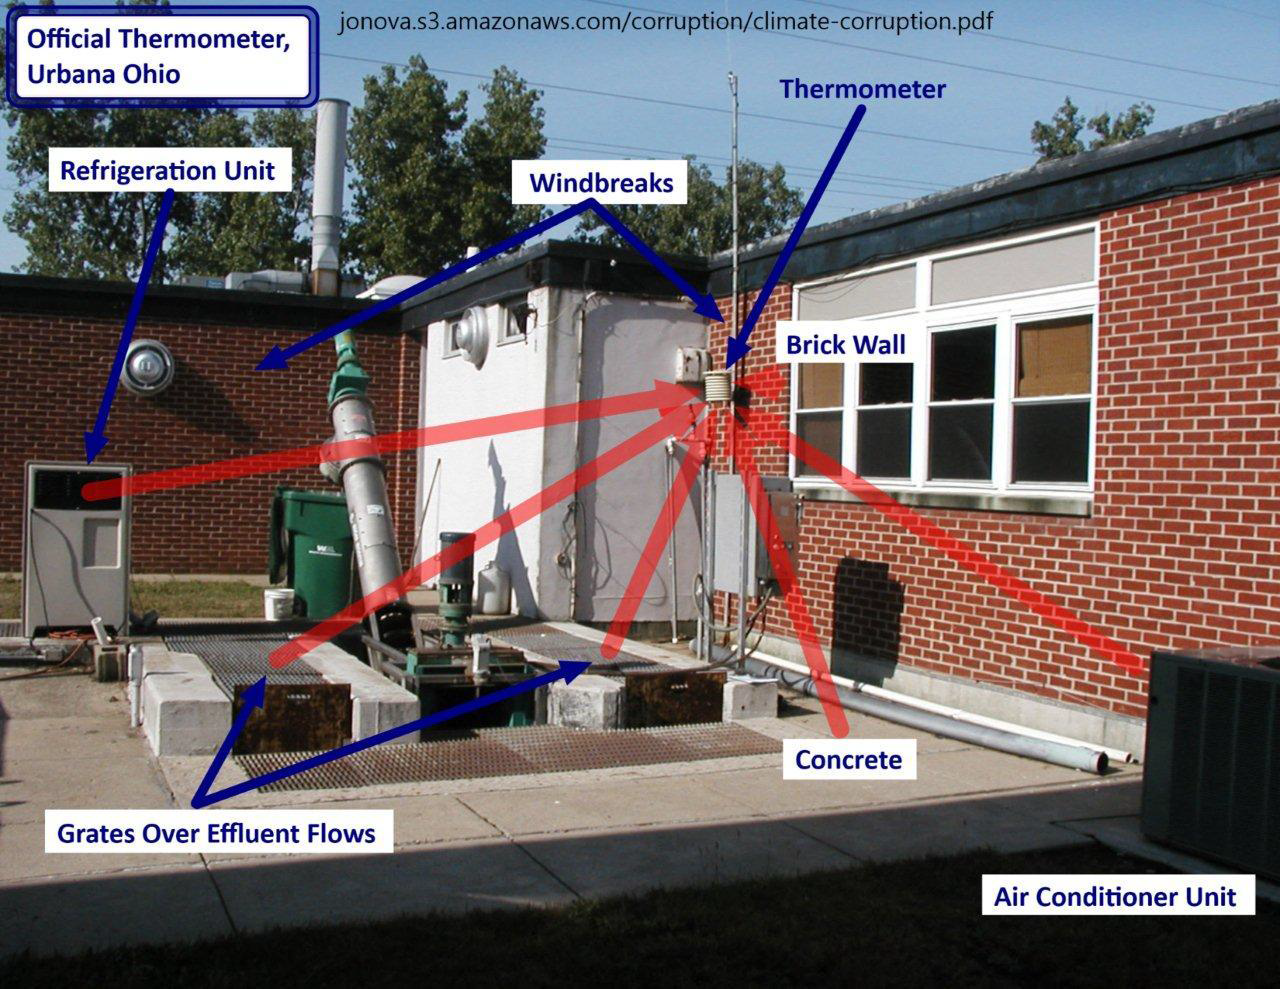
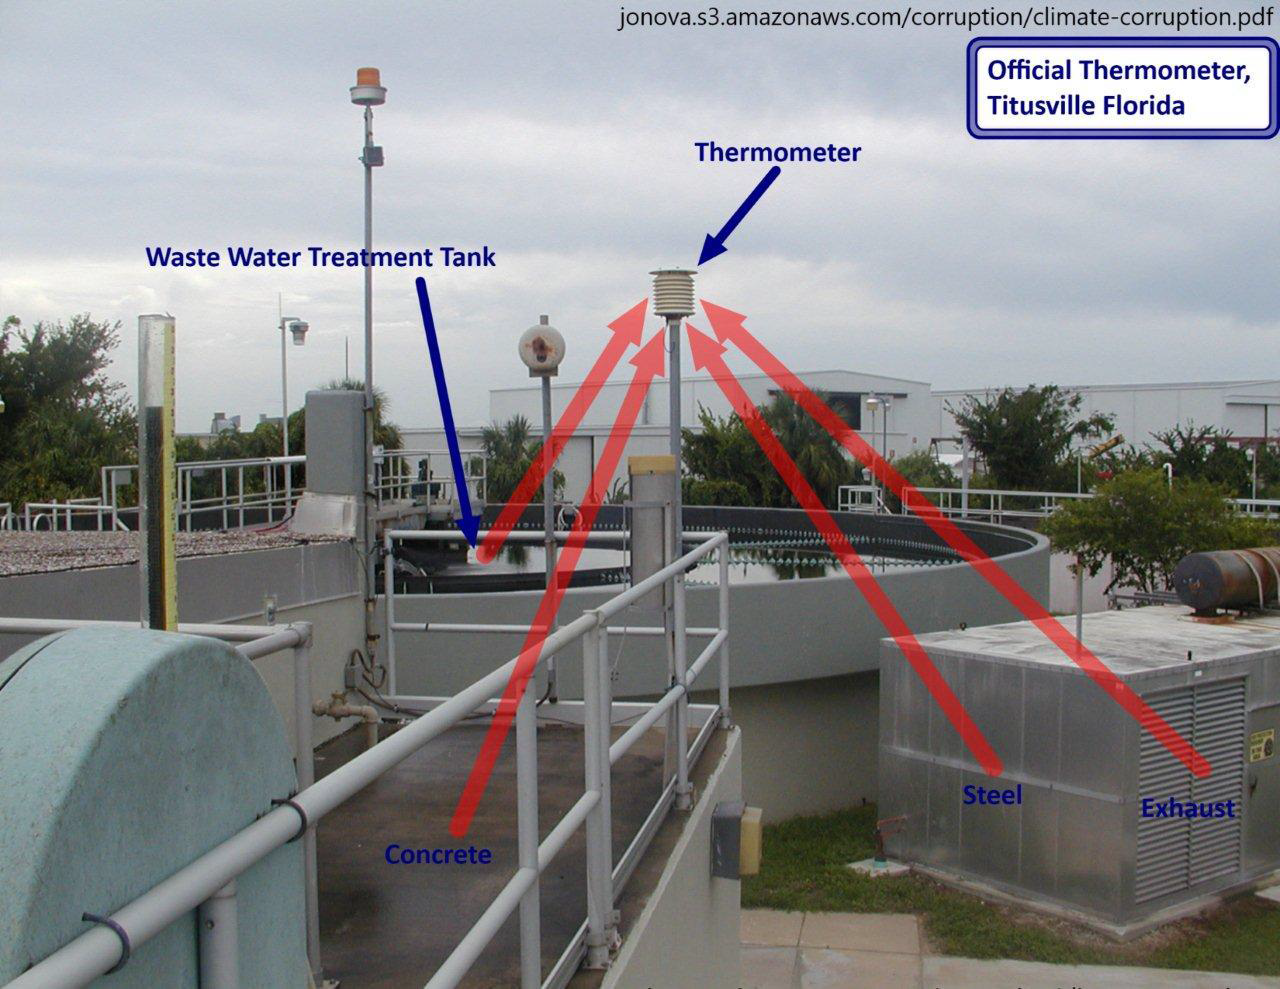
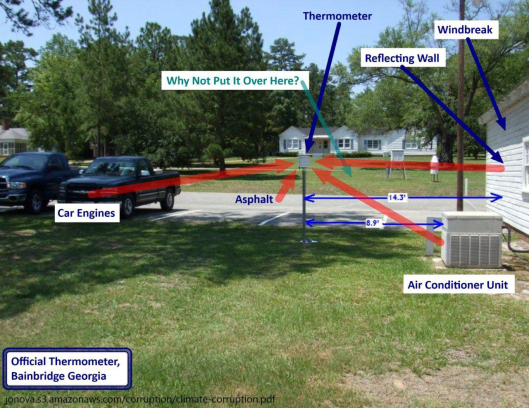
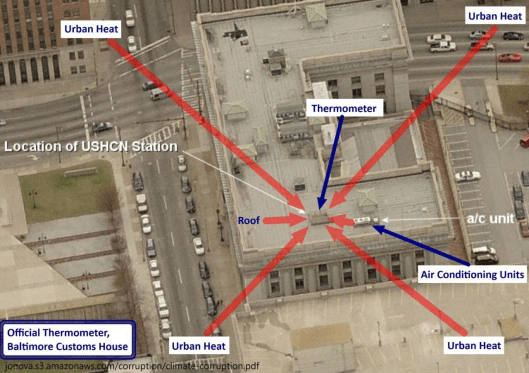
Additionally, the “hottest year on record”, 1998, was an El Nino year so it was naturally hotter than the years just before and after. Another “cause” of rising average global temperatures is the urban heat island effect. Cities are hotter than rural areas. Many of the reporting stations that were once in undeveloped rural areas have experienced either suburban or urban development, or the stations have been moved to more urban settings. It is well documented that some have been, seemingly intentionally, relocated near or at heat sources such as paved parking lots and air conditioners.

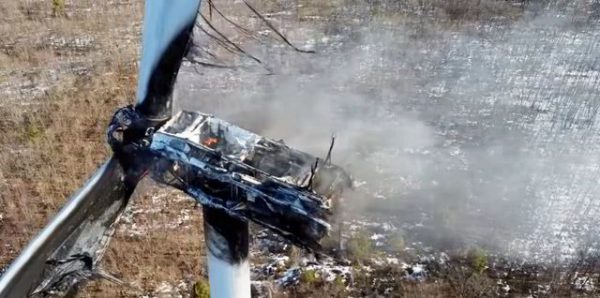
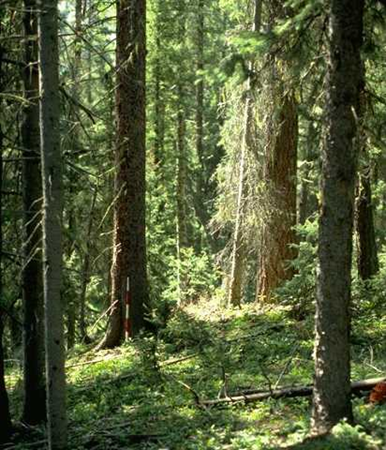
One reason for relocation near buildings or other structures could be that new automatic-reporting equipment needs to be connected by cable. Rather than dig up parking lots or roads to install units in a grassy or protected area, many have opted to locate them where they can be directly connected without involving costly excavation, although such sites do not meet the stated requirements. Instead of excluding data from stations that are poorly situated, a convoluted mathematical algorithm (scheme) is used to “correct” it to presumed pre-industrial levels. See illustrations below.

Urban Heat 6Urban Heat 8Urban Heat 7

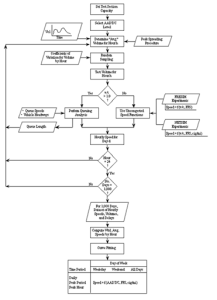
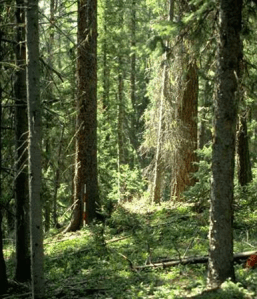
Urban area plus mathematical correction algorithm equals pristine nature

Source: “The Influence of anthropic surface processes and inhomogeneities on gridded global climate data” Slide 21, Powerpoint presentation to the American Chemical Society, Denver CO via Webinar, August 28 2011 by Ross McKitrick, Department of Economics, University of Guelph, Guelph ON Canada  http://www.rossmckitrick.com/general-overviews.html

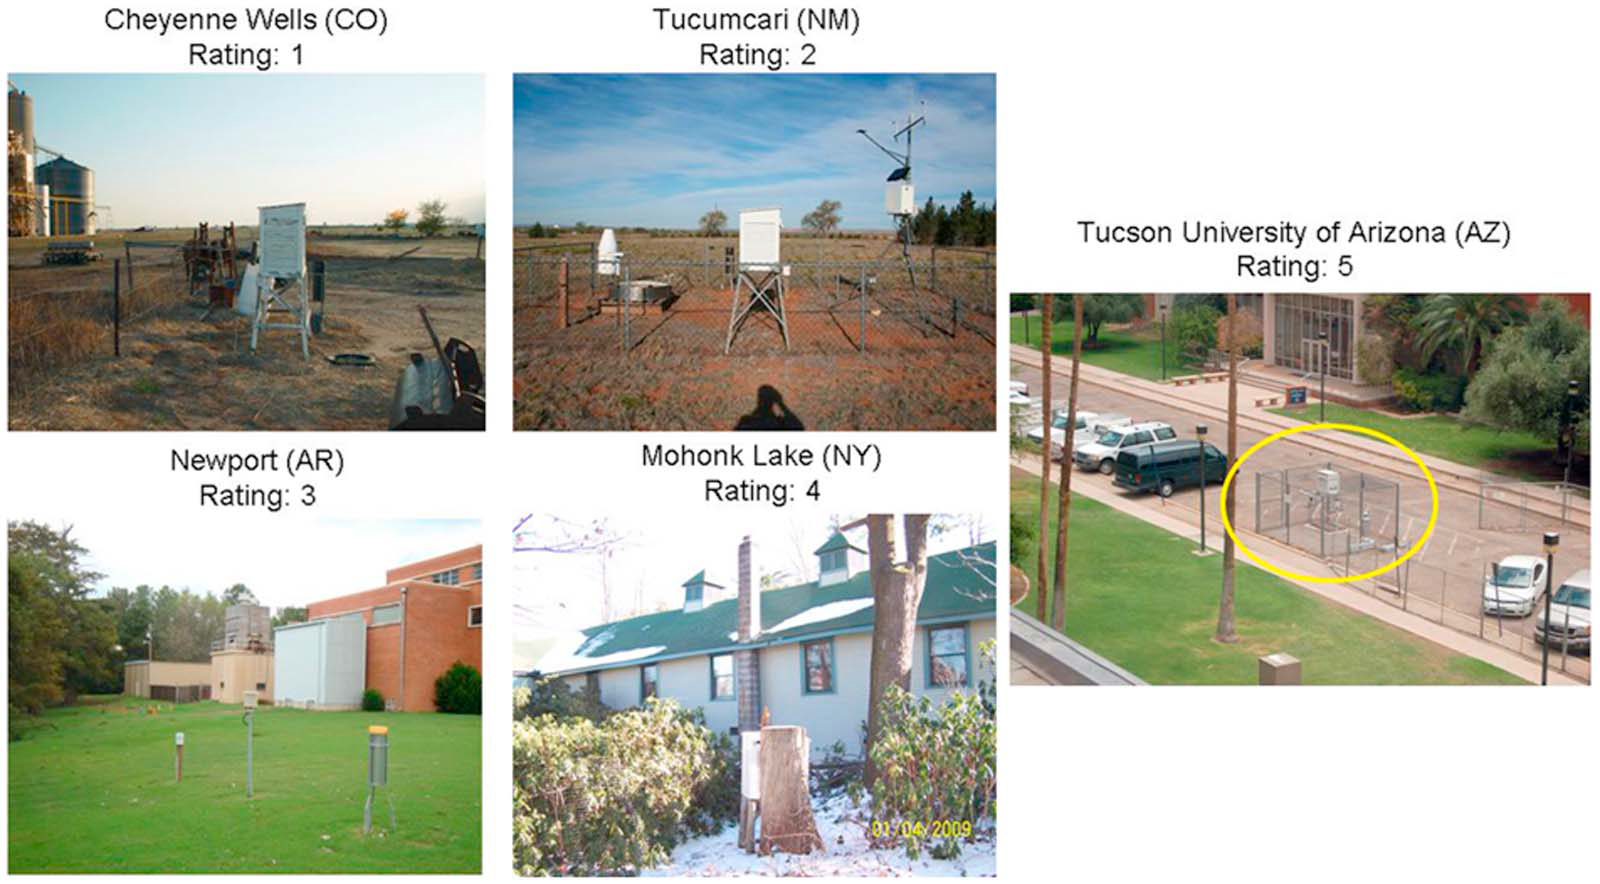
Proposed rating of reporting stations with regard to surroundings:

Urban Heat 5

Figure 3. U.S. Historical Climate Network (USHCN) station exposure at sites representative of each CRN class: CRN 1, a clear flat surface with sensors located at least 100 m from artificial heating and vegetation ground cover <10 cm high; CRN 2, same as CRN 1 with surrounding vegetation <25 cm and artificial heating sources within 30 m; CRN 3, same as CRN 2, except no artificial heating sources within 10 m; CRN 4, artificial heating sources <10 m; and CRN 5, sensor located next to/above an artificial heating source.

Source:  “Analysis of the impacts of station exposure on the U.S. Historical Climatology Network temperatures and temperature trends,” Souleymane Fall, Anthony Watts, John NielsenGammon, Evan Jones, Dev Niyogi, John R. Christy,5and Roger A. Pielke Sr., Journal of Geophysical Research, Vol. 116, D116, D14120  doi:10.1029/2010JD015146, 2011

See other examples below of poor placement of temperature reporting stations from “Is the Western Climate Establishment Corrupt?” The public might not understand the science, but they do understand cheating, Dr. David Evans, 11 Nov 2010 (last updated 28 Feb 2011) Web Address: jonova.s3.amazonaws.com/corruption/climate-corruption.pdf

 Urban Heat 4

Urban Heat 1

Urban Heat 2

Urban Heat 3

Claim 7 source is book, Perverted Truth Exposed: How Progressive Philosophy has Corrupted Science, 2016

Urbanization Effects on GHCN Temperature Trends, Part III: Using Population Density, 1880-2015 — Watts Up With That?

Eventually, all of this will lead to an estimation of how much of the land warming (say, since 1880) has been spurious due to the Urban Heat Island effect. The post Urbanization Effects on GHCN Temperature Trends, Part III: Using Population Density, 1880-2015 first appeared on Watts Up With That?.

Urbanization Effects on GHCN Temperature Trends, Part III: Using Population Density, 1880-2015 — Watts Up With That?