African Development Bank caves to UN and Environmentalist Pressure and abandons electrification goals. See excerpts from this TownHall.com article below. Read the full article by clicking here. Climate Alarmist Banks Go Carbon-colonialist Paul Driessen | Posted: Dec 28, 2019 12:01… Continue reading →
I had the privilege of attending a public policy briefing at the Department of Interior this week. Secretary Dave Bernhardt shared with us these slides spotlighting the fantastic deregulatory work he is doing. The following slides are courtesy of the Department of Interior.
This discussion with Mark Steyn is the only time Steve McIntyre, Ross McKitrick, and Anthony Watts have appeared together on stage. It occurred while on the Alaskan Mark Steyn Club Cruise in September.~cr From Mark Steyn online. Joining me for the discussion were three people at the forefront of pushing back against Michael E Mann…
When the world’s richest entrepreneur says wind and solar will never work, it’s probably time to listen. Bill Gates made a fortune applying common sense to the untapped market of home computing. The meme has it that IBM’s CEO believed there was only a market for five computers in the entire world. Gates thought otherwise. Building […]
Here it is. Please review and send me your thoughts. Supposedly this is what will be sent to the White House for review and approval. This is my favorite part so far: If true, this would mean the the Harvard Six City and Pope ACS studies are history and won’t be used by EPA again.…
EPA is cleaning up its act with new, science-based, transparent data that can be verified and replicated by independent researchers. No one should object to better data methods unless they want to block advances in science or support embedded myths of environmentalism. The Harvard Six City study was begun in 1974 and followed participants for 15 years. It used questionnaire type surveys of participants and followed up with spirometry testing and death dates/causes. Death rate only varied by 2 years for most and least polluted cities, which could be a statistical fluke. It has been 40 years since the study was ended, so confidentiality should not be a problem, except to redact names.
This new proposed ruling by the EPA, along with ending the Linear No Threshhold method of risk determination should be celebrated in the scientific and medical communities. It means more research, not less, and more accurate data overall.
By Paul Homewood Not only is the UK Met Office desperate to declare a new record temperature from an extremely dodgy site in Cambridge, but a newly claimed record temperature in Germany also appears to be a cheat: During last week’s record-setting European heat wave, Germany’s previous record of 40.3C was impressively […]
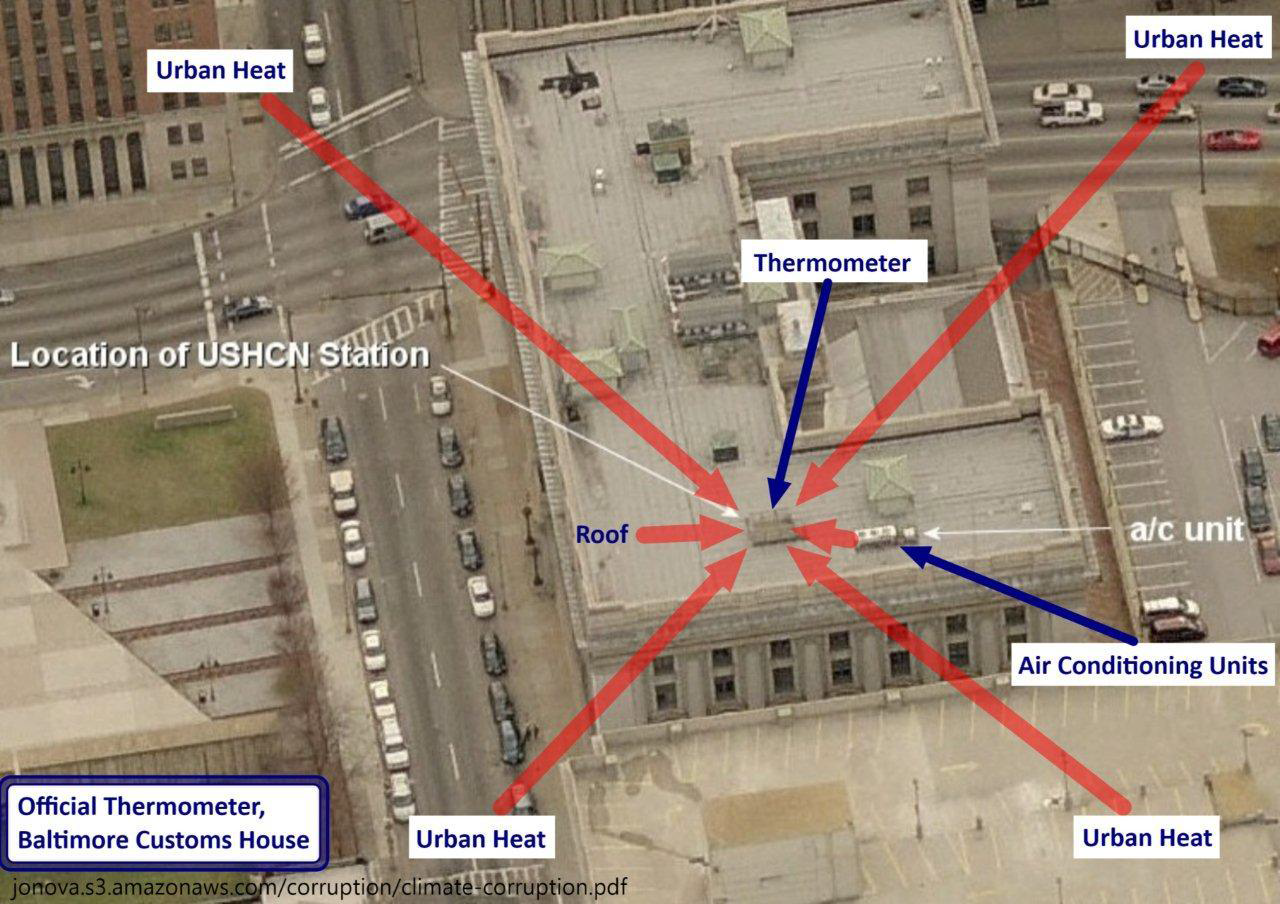
. . . One “cause” of rising average global temperatures is the urban heat island effect. Cities are hotter than rural areas. Many of the reporting stations that were once in undeveloped rural areas have experienced either suburban or urban development, or the stations have been moved to more urban settings. It is well documented that some have been, seemingly intentionally, relocated near or at heat sources such as paved parking lots and air conditioners.
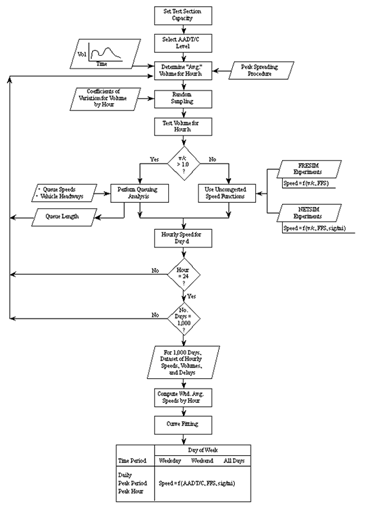
One reason for relocation near buildings or other structures could be that new automatic-reporting equipment needs to be connected by cable. Rather than dig up parking lots or roads to install units in a grassy or protected area, many have opted to locate them where they can be directly connected without involving costly excavation, although such sites do not meet the stated requirements. Instead of excluding data from stations that are poorly situated, a convoluted mathematical algorithm (scheme) is used to “correct” it to presumed pre-industrial levels. See illustrations below.
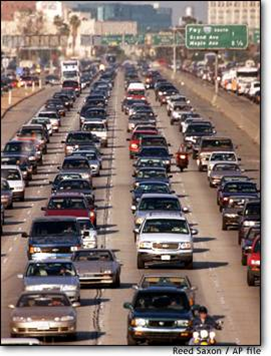
One additional problem with the newer sensors is their fast response. Since they record the high and low temperature point each day, not the average, they can report a transient heat source like a passing bus, an idling auto or jet engine exhaust at the airport instead of the actual ambient temperature.
Actual Conditions are run through a algorithm (below)Example flow chart of algorithms used to correct actual dataCorrected data approximated by algorithm
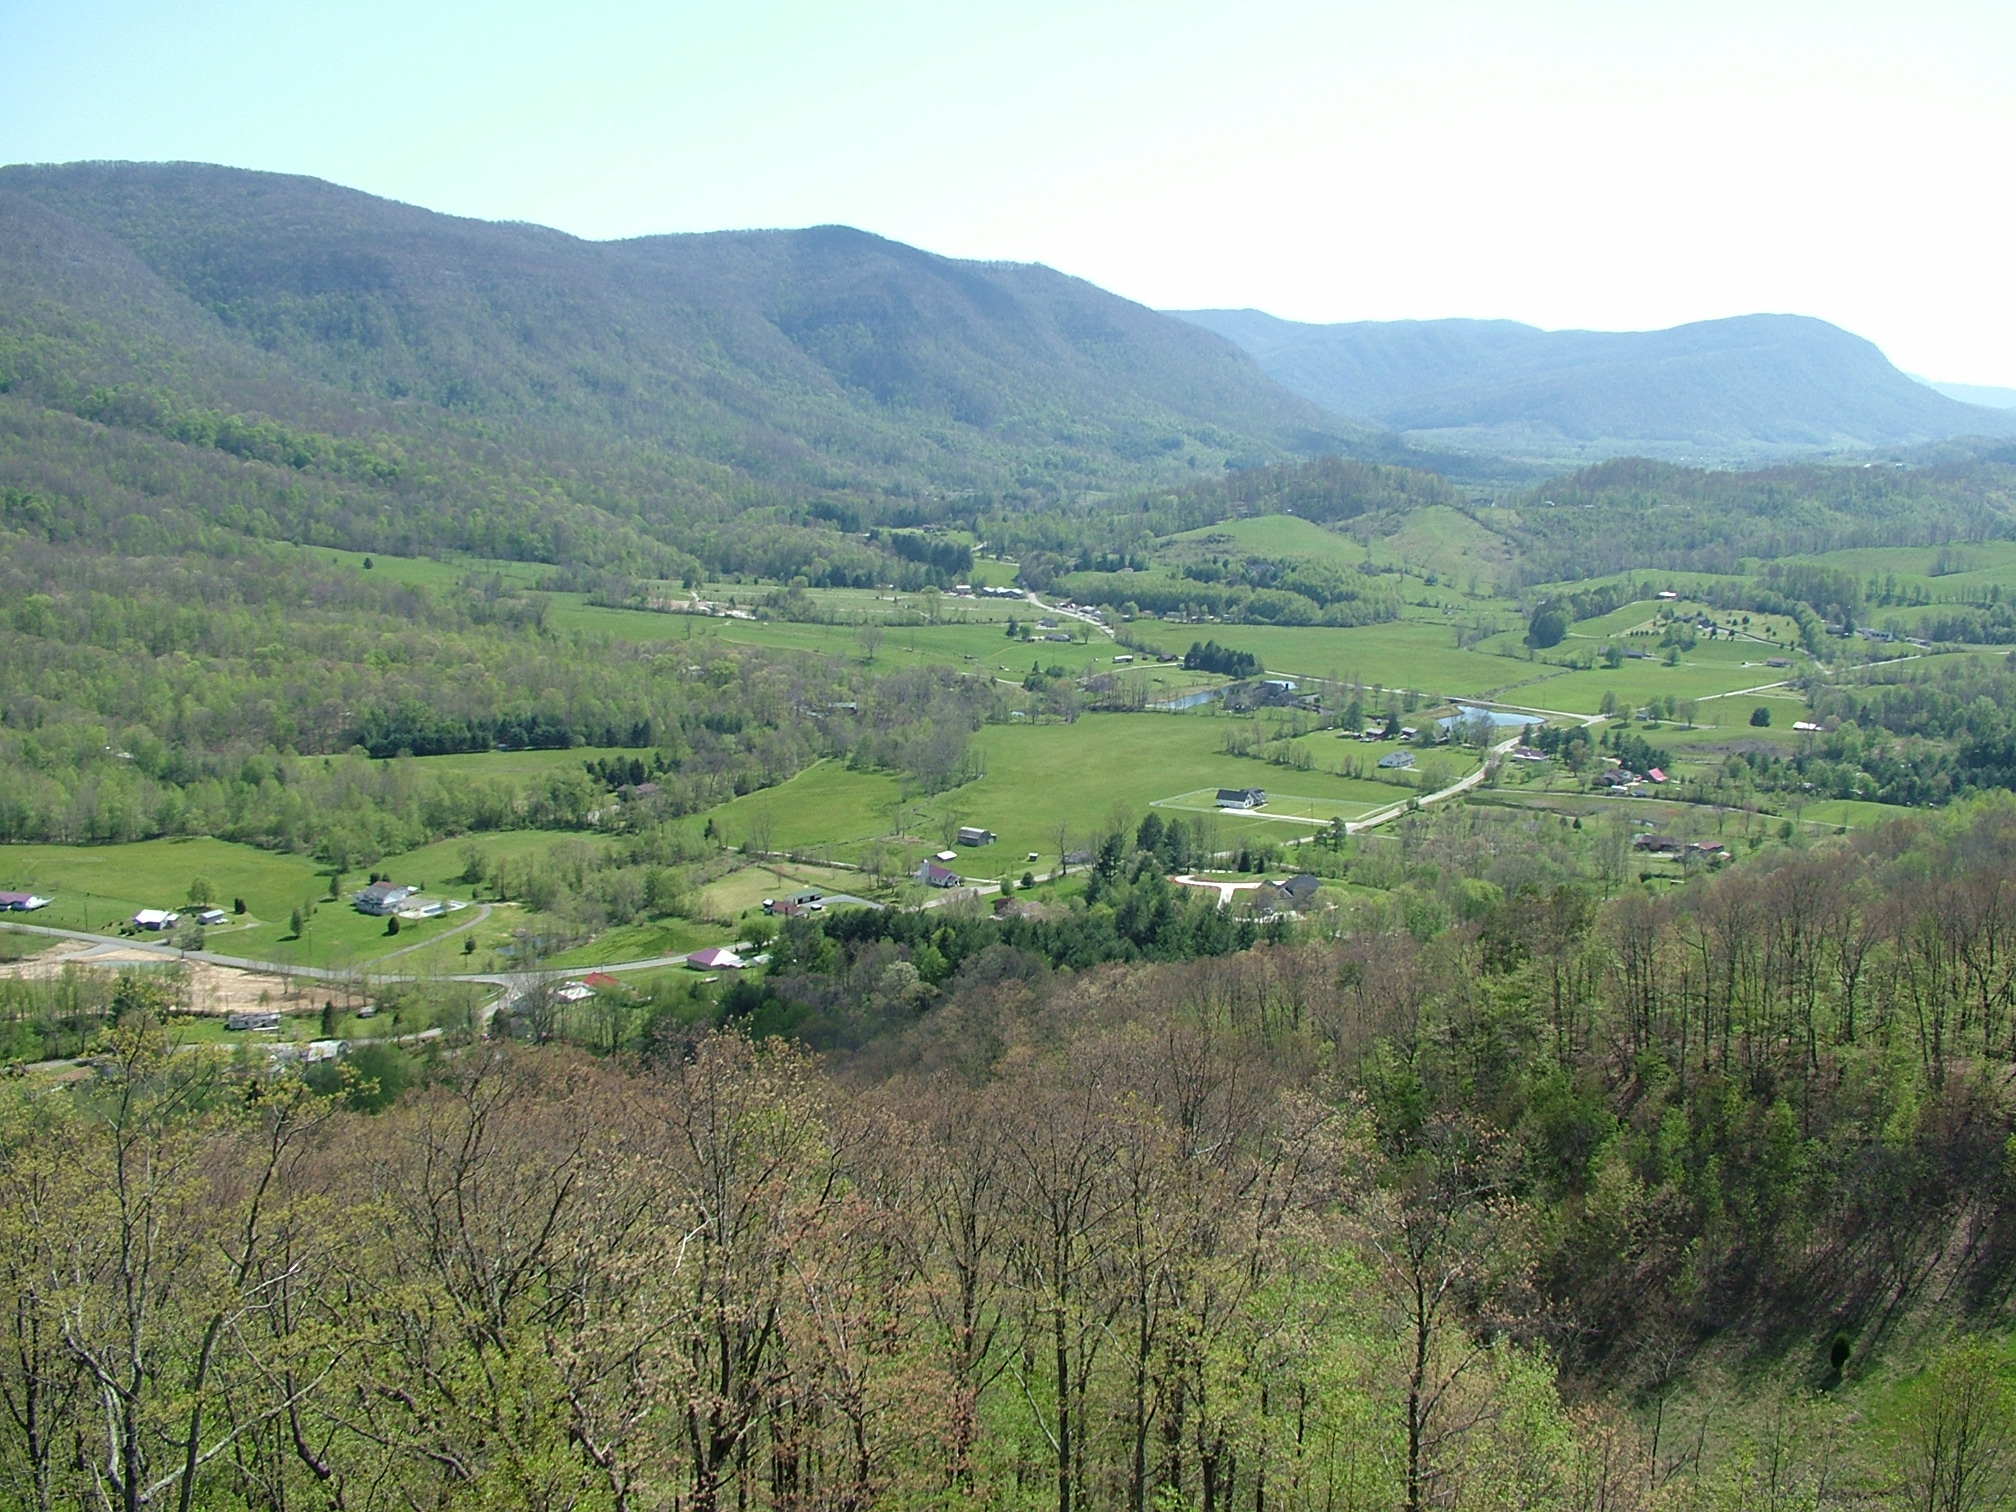
Urban area plus mathematical correction algorithm equals pristine nature
Source: “The Influence of anthropic surface processes and inhomogeneities on gridded global climate data” Slide 21, Powerpoint presentation to the American Chemical Society, Denver CO via Webinar, August 28 2011 by Ross McKitrick, Department of Economics, University of Guelph, Guelph ON Canada http://www.rossmckitrick.com/general-overviews.html
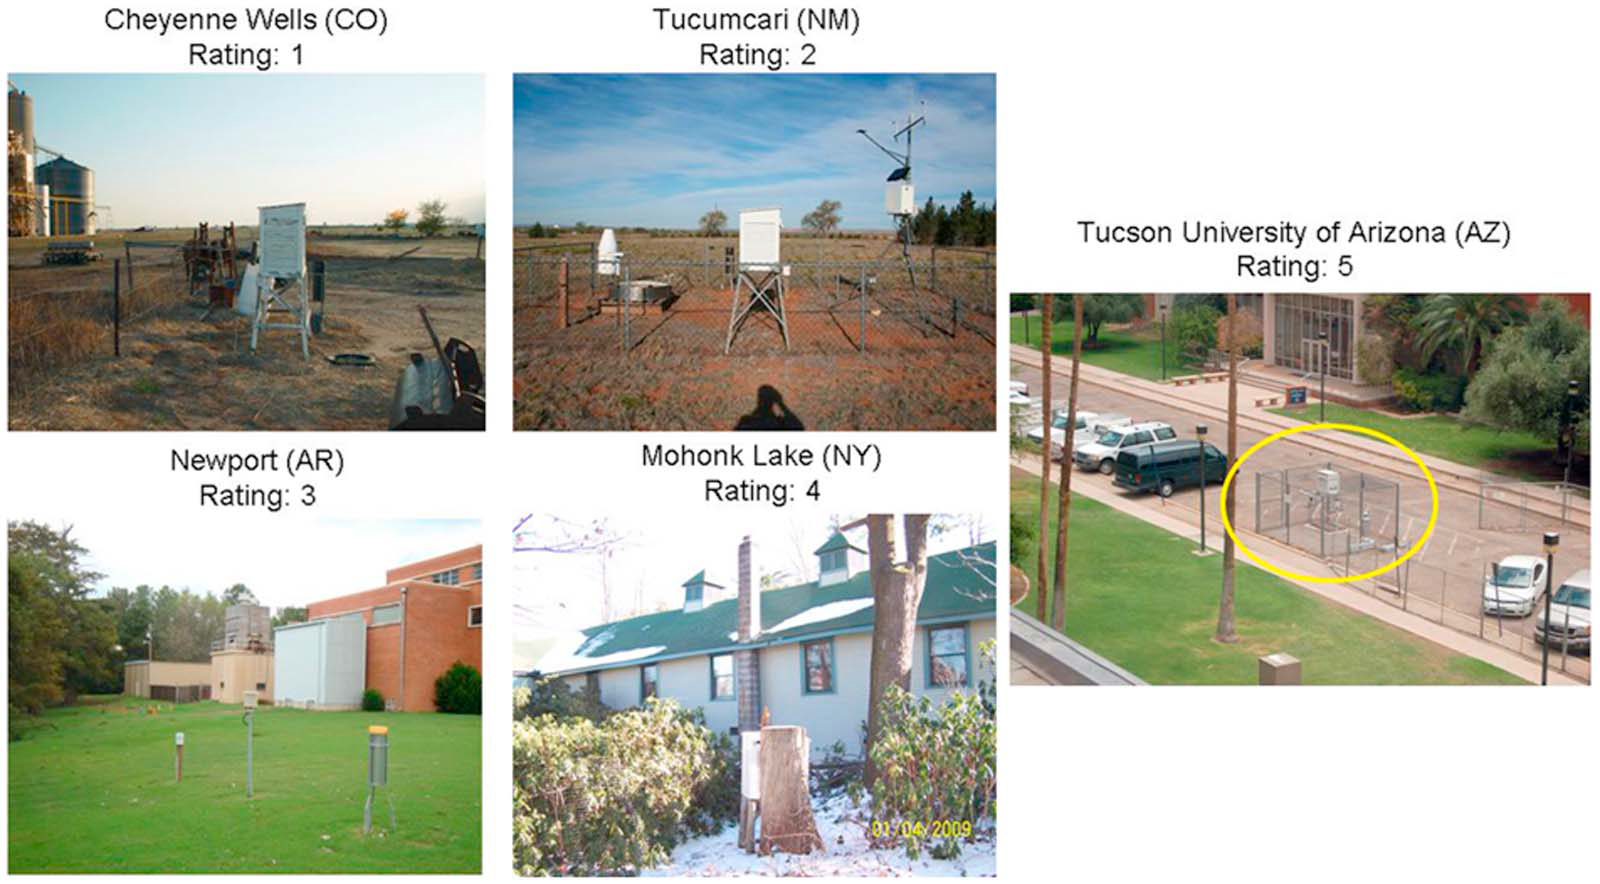
Proposed rating of reporting stations with regard to surroundings:
Figure 3. U.S. Historical Climate Network (USHCN) station exposure at sites representative of each CRN class: CRN 1, a clear flat surface with sensors located at least 100 m from artificial heating and vegetation ground cover <10 cm high; CRN 2, same as CRN 1 with surrounding vegetation <25 cm and artificial heating sources within 30 m; CRN 3, same as CRN 2, except no artificial heating sources within 10 m; CRN 4, artificial heating sources <10 m; and CRN 5, sensor located next to/above an artificial heating source.
Source: “Analysis of the impacts of station exposure on the U.S. Historical Climatology Network temperatures and temperature trends,” Souleymane Fall,Anthony Watts,John Nielsen‐Gammon,Evan Jones,Dev Niyogi,John R. Christy,5and Roger A. Pielke Sr., Journal of Geophysical Research, Vol. 116, D116, D14120 doi:10.1029/2010JD015146, 2011
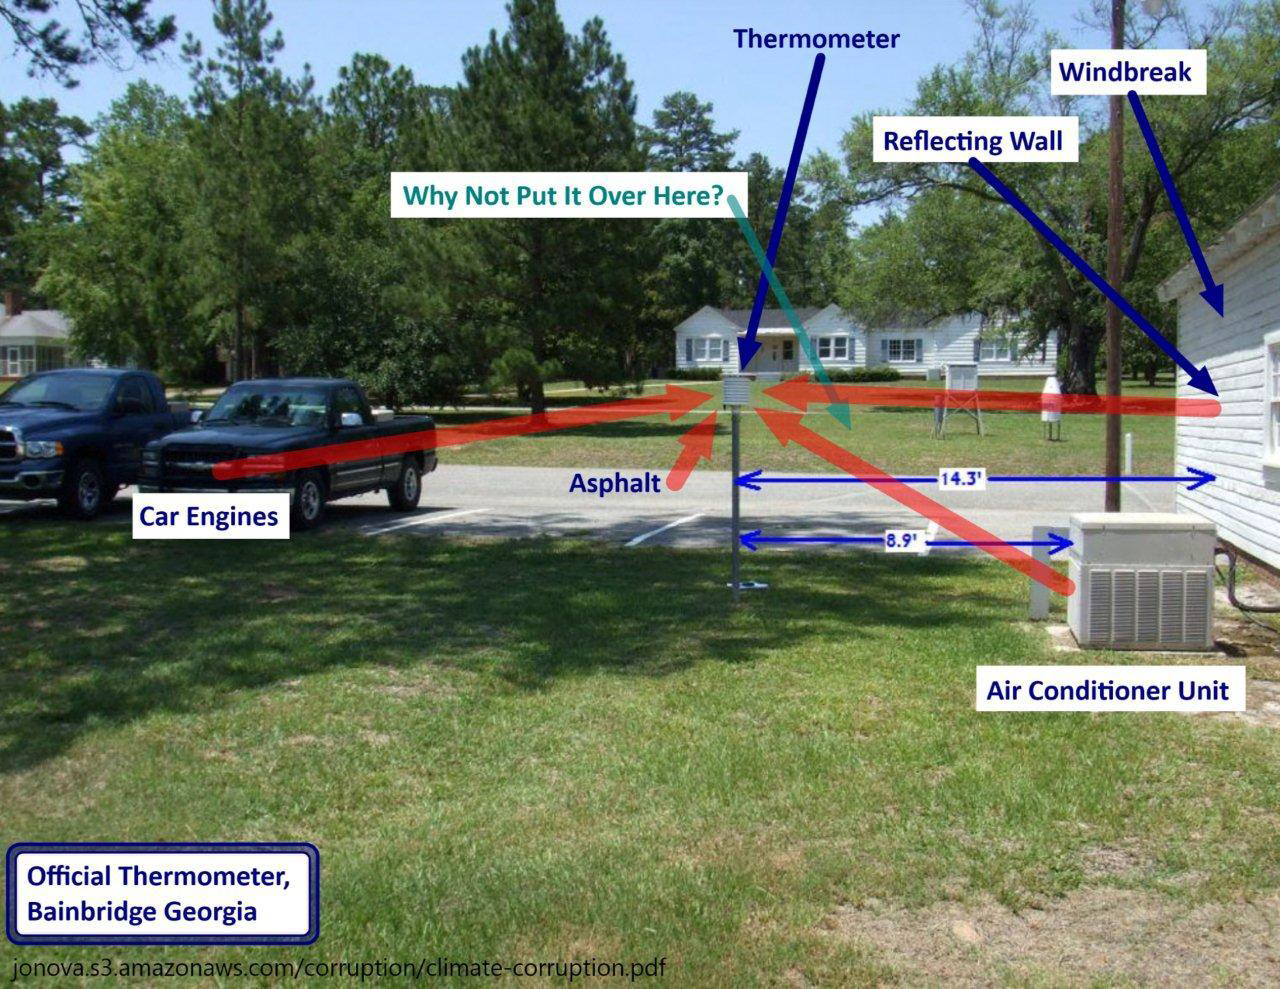
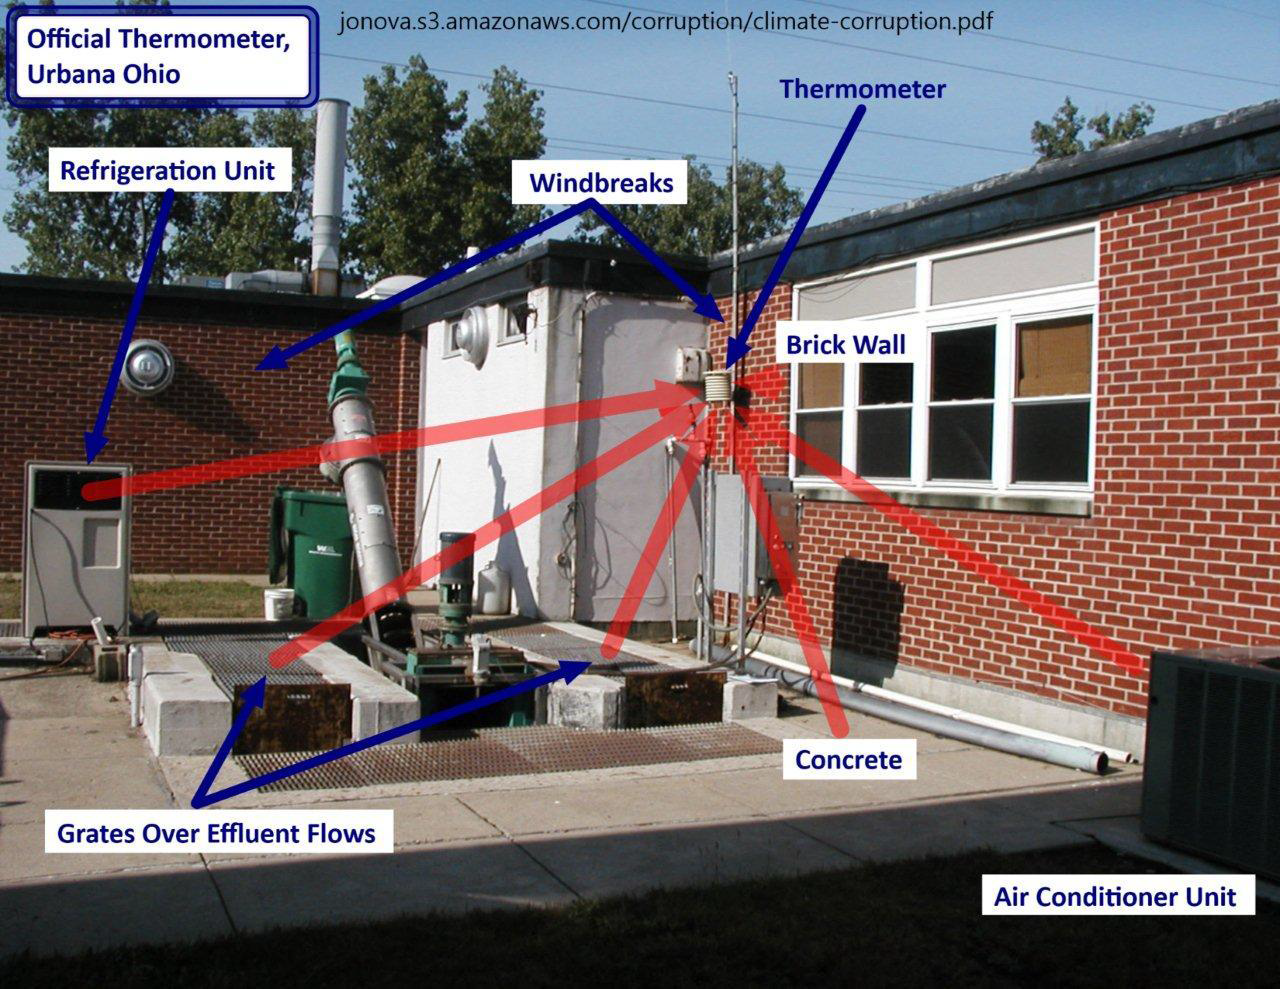
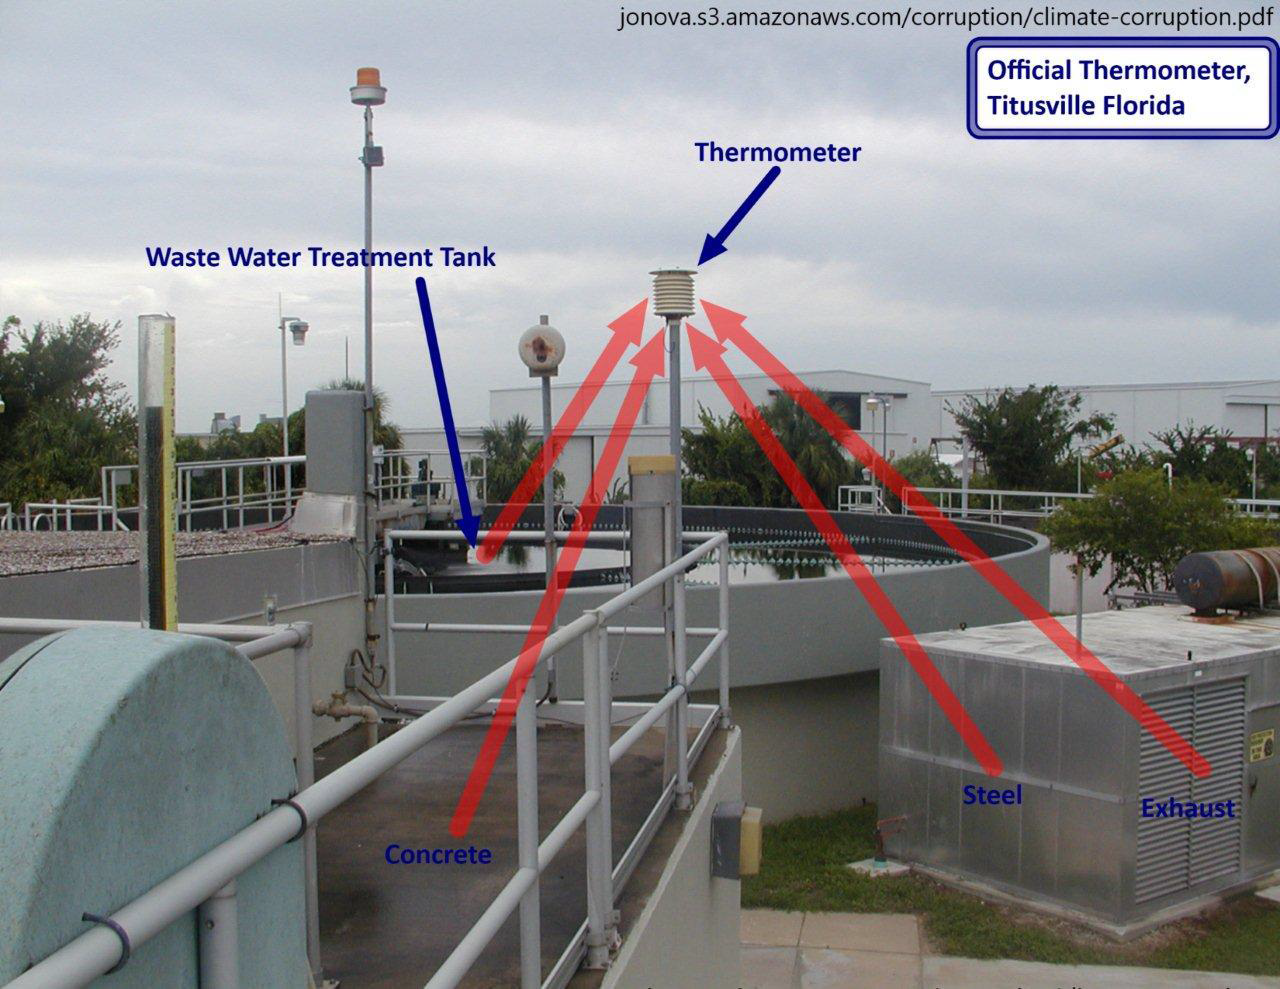
See other examples below of poor placement of temperature reporting stations from “Is the Western Climate Establishment Corrupt?” The public might not understand the science, but they do understand cheating, Dr. David Evans, 11 Nov 2010 (last updated 28 Feb 2011) Web Address: jonova.s3.amazonaws.com/corruption/climate-corruption.pdf
Guest essay by Eric Worrall Genius cartoonist Scott Adams published a Sunday cartoon panel offensive to the climate religion. From “Climate Change ” is the new universal boogeyman department. Just in case you think this cartoon is too ridiculous to be true, there are plenty of real world examples of people trying to blame climate…