Political Corruption of Science Revealed in New Book

Perverted Truth Exposed cover image

In Perverted Truth Exposed, Kay Kiser exposes areas of science that have been corrupted by progressive and atheist philosophies disguised as science, including  evolution, origin of life, cosmology, quantum physics and climate change.

The climate change debate presents a modern example of how the perversion of science is politically imposed to support an anti-God, anti-human progress agenda of Marxist control and power while silencing opposition through intimidation. Kiser also answers:

  • Did Darwin really steal his theory of evolution from Alfred Wallace?
  • Why did Wallace later abandon the theory as not having sufficient evidence?
  • If Hubble discovered the expanding universe leading to the Big Bang Theory, why did he continually try to convince others that their conclusion was wrong?
  • Is man-made carbon dioxide causing global warming or is it a trailing indicator of climate change in a system dominated by solar cycles, cloud cover, and ocean currents?

Available online from the following outlets in print and as an eBook.

Bring back DDT – Save Africa and other impoverished areas

Bring back DDT – Save Africa and other impoverished areasmosquite-feeding

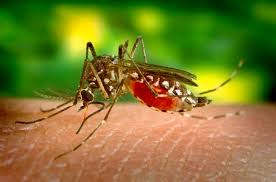
Over 80% of infectious diseases are caused by insects and other arthropods. DDT is desperately needed in impoverished countries where insect borne diseases kill and sicken millions every year, cutting lifespans and productivity.  Africa, India and South-Central Americas are most affected. This unpardonable crime amounts to continuing genocide of brown races by western powers.

Without these insect borne diseases, populations may increase at first, but better health will facilitate the building of infrastructure and industry that can raise millions out of poverty, ignorance and hopelessness.


“How much labor and waste of time these wicked insects do cause, but a ray of hope, in the use of DDT, is now held out to us.”            — Out of My Life and Thought: An Autobiography, Dr. Albert Schweitzer (translated from Ma Vie et Ma Pensee)


DDT worked so well that malaria and similar diseases were eradicated in most developed countries and were near eradication in poorer countries before DDT was banned in 1972 by EPA in spite of failure to find any harm to humans or the environment by an overwhelming body of research.


“To only a few chemicals does man owe as great a debt as to DDT. It has contributed to the great increase in agricultural productivity, while sparing countless humanity from a host of diseases, most notably, perhaps, scrub typhus and malaria. Indeed, it is estimated that, in little more than two decades, DDT has prevented 500 million deaths due to malaria that would otherwise have been inevitable. Abandonment of this valuable insecticide should be undertaken only at such time and in such places as it is evident that the prospective gain to humanity exceeds the consequent losses. At this writing, all available substitutes for DDT are both more expensive per crop-year and decidedly more hazardous.”

— National Academy of Sciences, Committee on Research in the Life Sciences of the Committee on Science and Public Policy, The Life Sciences: Recent Progress and Application to Human Affairs, The World of Biological Research, Requirements for the Future (Washington, D.C.: GPO, 1970), 432.                             (Emphasis added)


Rachel Carson’s 1962 book, Silent Spring, was filled with lies, half-truths, misinterpretation of research results and wild speculations.  Rather than being an attempt to protect humans and the environment as stated, it was really part of an effort to stop population increases in Africa, India and other impoverished countries.


“My own doubts came when DDT was introduced for civilian use. In Guyana, within two years it had almost eliminated malaria, but at the same time the birth rate had doubled. So my chief quarrel with DDT in hindsight is that it has greatly added to the population problem.”

                          —Alexander King, cofounder of the Club of Rome, 1990


Population Bomb by Paul Erilich (1968) was a another book based on Malthusian, eugenicist, racist lies, aka propaganda.


“The battle to feed all of humanity is over. In the 1970s hundreds of millions of people will starve to death in spite of any crash programs embarked upon now. At this late date nothing can prevent a substantial increase in the world death rate…”                              — Paul Ehrlich, The Population Bomb, 1968


Population control groups such as the Club of Rome, supported by charitable foundations such as the Rockefeller Foundation, continue to spread the myth of overpopulation.  Many rural areas have too few healthy people to build roads, other infrastructure and industry.

In 1972 DDT was banned by US EPA Administrator William Ruckelshaus in spite of overwhelming scientific evidence presented at hearings that refuted claims of harm by activist groups such as Environmental Defense Fund and Audubon Society.


“DDT is not a carcinogenic, mutagenic, or teratogenic hazard to man. The uses under regulations involved here do not have a deleterious effect on fresh water fish, estuarine organisms, wild birds, or other wildlife…and…there is a present need for essential uses of DDT.”                — EPA Administrative Law Judge Edmund Sweeney, after months of hearings, “In the Matter of Stevens Industries, Inc., et al., L.F. & R. Docket Nos. 63, et al.). Hearing Examiner’s Recommended Findings, Conclusions, and Orders, April 1972.” (40 CFR 164.32). (Consolidated DDT Hearings)  As summarized in Barrons, May 1, 1972


Beginning the 1970’s, US AID, UN WHO, UNESCO and the World Bank have pressured leaders of poor countries to discontinue DDT as a prerequisite to receiving essential aid. This continues to the present with exception of recently allowing limited spraying of interior wall in selected areas.

Although DDT is the most studied pesticide on the planet, it is still listed as an environmental toxin and possible carcinogen because the EPA listing has not changed, in spite of all of the studies that failed to find harmful effects on humans or the environment. It is much safer and more economical than any of the proposed replacements.

Verifying the Claims of Silent Spring

None of Rachel Carson’s “facts” about environmental and human harm were true. Most of the facts below, except where noted, are from “DDT: A Study in Scientific Fraud,” by J. Gordon Edwards, Journal of American Physicians and Surgeons Volume 9 Number 3 Fall 2004. (See link below)

Dr. Edwards examined each of Silent Spring’s claims and found them wrong and possibly fraudulent.

Not one person has been harmed or died from DDT.

  • The only death associated with DDT was a 3 yr. old child that drank a solution of DDT in kerosene, which is a hydrocarbon known to be toxic.
  • J. Gordon Edwards was a Ph.D. entomologist who sometimes ate a spoonful of DDT powder at his lectures as a demonstration of its safety. He suffered no significant ill effects and died of a heart attack at age 84 while hiking in the Rockies.

DDT is not carcinogenic, mutagenic or teratogenic

  • “Workers in the Montrose Chemical Company had 1,300 man-years of exposure, and there was never any case of cancer during 19 years of continuous exposure to about 17mg/man/day.”
  • “Concerns were sometimes raised about possible carcinogenic effects of DDT, but instead its metabolites were often found to be anti-carcinogenic, significantly reducing tumors in rats.”
  • Expected rise in leukemia in children and breast cancer years later in girls exposed during puberty never happened.

Bird deaths, thin egg shells and buildup in the environment have proven to be false.

  • Bird deaths at the University of Michigan, cited by Carson, were not from DDT, but were probably from soil fungicide containing mercury. In later tests, mercury was found in the soil and earthworms there. Other areas did not experience bird deaths from spraying of DDT. Carson’s Source was: Bird Mortality in the Dutch elm disease program in Michigan, Bulletin 41, Cranebrook Institute of Science by George John Wallace; Walter P Nickell; Richard F Bernard
  • According to Audubon Society Annual Christmas Bird Counts, bird populations actually increased during the thirty years of DDT use. Numbers rose from 90 birds seen per observer in 1941 to 971 birds seen per observer in 1960.
  • The eggshell thinning studies cited by Carson could not be replicated and had actually reduced dietary calcium, needed to build egg shells, of experimental birds to get that result.
  • Museum specimens compared to wild population eggs may have led to false claims of thinning because the museums used the best specimens available; natural variability in the wild may have been interpreted as thinning. “the whole idea that pesticides are concentrated as one moves up the food chain, which is crucial to Carson’s arguments about distant and delayed effects, has become increasingly dubious in the years that followed” (Fleming, New Conservation Movement, 31). Source: Reading Rachel Carson by Charles T. Rubin
  • DDT is not metabolized by birds and is rapidly excreted in their droppings.
  • “The counts of raptorial birds migrating over Hawk Mountain, Pennsylvania, indicated that there were many more hawks there during the “DDT years” than previously. The numbers counted there increased from 9,291 in 1946 (before much DDT was used) to 13,616 in 1963 and 29,765 in 1968, after 15 years of heavy DDT use.”

Aquatic life has not been harmed by DDT; it is practically insoluble in water, with only 1.2 parts per billion at saturation.

  • A study cited by Carson claimed 500 ppb DDT in seawater inhibited photosynthesis and killed algae. The problem with this study is that alcohol was added to the tank to dissolve the DDT in the water. Alcohol alone would do that.
  • The assumption of persistence of DDT in seawater for decades was also challenged. Tests showed DDT and its metabolites disappeared in as few as 38 days.

References:

See “DDT: A Study in Scientific Fraud,” by J. Gordon Edwards, Journal of American Physicians and Surgeons Volume 9 Number 3 Fall 2004. On the web at:

http://www.jpands.org/vol9no3/edwards.pdf

See also “The Truth about DDT and Silent Spring” by Robert Zubrin, adapted from Robert Zubrin’s Merchants of Despair: Radical Environmentalists, Criminal Pseudo-Scientists, and the Fatal Cult of Antihumanism, published in 2012, in New Atlantis Books series. On the web at:

www.thenewatlantis.com/publications/the-truth-about-ddt-and-silent-spring

The Truth about Zika Virus and Microcephaly

Facts about Zika virus and Microcephaly.microcephaly

Is there a cause and effect link or merely a correlation of unrelated events? Here is the story and the facts so far.  In October 2015 an increase in microcephaly was reported in Brazil. A Brazilian doctor, Adriana Melo, at IPESQ, a research insti­tute in Campina Grande, was the first to report a firm link between Zika and microcephaly. Several months before, there had been an outbreak of Zika virus throughout Brazil. The increase in microcephaly cases occurred only in a coastal state in the northeast of the country.

90% of the 1709 cases of microcephaly and birth defects were concentrated in this limited area. Of this number 1153 were diagnosed as microcephaly. There was no increase in other parts of the country, including an adjoining coastal state with a similar population, which only had 3 cases. This suggests there may be other contributing factors. Socio-economic factors may contribute since most of the mothers of the microcephalic babies were young, single, black and poor, living in small cities near larger cities. Additionally, this same northeastern region has always had the highest incidence of microcephaly in Brazil.

A study by the Latin American Collaborative Study of Congenital Malformations (ECLAMC) called for more controlled studies, and concluded that the data so far is inconclusive of a cause and effect link between Zika infection in the first trimester of pregnancy and microcephaly and similar nervous system defects. For an English translation of the original Portugese summary of the ECLAMC studies, see http://www.nature.com/polopoly_fs/7.33594!/file/NS-724-2015_ECLAMC-ZIKA%20VIRUS_V-FINAL_012516.pdf

This report discusses weaknesses in the methods used by IPESQ, recommendations for further studies and several other factors that may have caused or contributed to the birth defects as listed below.

  • Rumor may have caused over reporting due to active searches and over diagnosis. Brazil health authorities estimate that as many as 2/3 of cases are normally not reported to authorities. If the estimate is correct, this would partially account for an increase, but not the degree reported, so other factors must be involved. However, Brazil reports a rate of 0.5 per 10,000 births compared to EUROCAT of 2.85 per 10,000 births, indicating a gross under reporting.
  • Broadened criteria for microcephaly diagnosis from 3 standard deviations to 2 standard deviations below normal average age and sex adjusted head circumference, and no confirming follow up brain scans or autopsies in most cases.
  • Zika infection in the first trimester of pregnancy cannot be confirmed at the time of birth because the virus is short-lived in the body and will not be present in the mother. Unless the mother was diagnosed early in her pregnancy, occurrence and connection cannot be confirmed.
  • In the original studies other known causes were not ruled out such as STORCH (syphilis, toxoplasmosis, “other,” rubella, cytomegalovirus, herpes simplex), prematurity, diabetes of the mother and fetal alcohol syndrome, a major cause of microcephaly in Brazil.
  • Also not ruled out are possible co-infections with dengue or chikungunya, both present in the population in recent outbreaks. The dengue virus is similar to the Zika virus and difficult to differentiate in tests.
  • A low rate of yellow fever vaccination also seems to correlate to this incident. Yellow fever virus is similar to Zika virus and vaccination may offer some immunity to it.
  • At IPESQ Bovine diarrheal virus (BVDV) was found in brain tissue of 3 fetuses in a later study. This virus does not usually infect humans but is known to cause birth defects in cattle. If true, this may be significant, but Dr. Adriana Melo suspects it may be a contaminant in the sampling or testing procedures.
  • Contaminated water was not considered, although it is common for small cities without proper sanitation and water purification to have biologically contaminated water.
  • Nutrition was not considered in this study other than a mention of general socio-economic influences, although the CDC, NIH and other agencies recognize folic acid (a B vitamin) deficiency as one of the leading causes of neural tube defects (NTD), including microcephaly, anencephaly, and spina bifida. In a recent NIH study they found that other micronutrients may decrease the risk of NTD occurrence, including thiamin (B1), riboflavin (B2), niacin (B3), pyridoxine (B6), betaine (a B vitamin), vitamin A, retinol (A1), vitamin C, vitamin E and iron.

In conclusion, the “link” between Zika virus and microcephaly is far from proven because the original studies lacked scientific discipline and controls. More studies are needed to clarify what role the virus may play in these birth defects. However, it is probably best to take a precautionary approach until more is known.

Is it time to bring back DDT to eradicate the mosquitos that carry Zika and other diseases such as malaria, dengue fever, chikungunya, yellow fever and other diseases? Over 80% of infectious diseases are caused by insects. Assumed adverse environmental and health effects of this important insecticide have failed to materialize in many repeated controlled studies over the last 40 years. See “DDT: A Case Study in Scientific Fraud,” by J. Gordon Edwards, PhD entomology, Journal of American Physicians and Surgeons Volume 9 Number 3 Fall 2004, at http://www.jpands.org/vol9no3/edwards.pdf

References:

“Eclamc Final Document – V.3, Summary and conclusions of Documents 1-5,” December 30th, 2015 http://www.nature.com/polopoly_fs/7.33594!/file/NS-724-2015_ECLAMC-ZIKA%20VIRUS_V-FINAL_012516.pdf

“Neural Tube Defects and Maternal Intake of Micronutrients Related to One-Carbon Metabolism or Antioxidant Activity,” US National Institute of Health, Angela L. Chandler1, Charlotte A. Hobbs1, Bridget S. Mosley1, Robert J. Berry2, Mark A.Canfield3, Yan Ping Qi2, Anna Maria Siega-Riz4, Gary M. Shaw5, and National Birth Defects Prevention Study, in Birth Defects Res A Clin Mol Teratol. 2012 November ; 94(11): 864–874. doi:10.1002/bdra.23068.

  1. Department of Pediatrics, College of Medicine, University of Arkansas for Medical Sciences, Arkansas Children’s Hospital Research Institute, Little Rock, AR 72202
  2. Centers for Disease Control and Prevention, Atlanta, Georgia
  3. Birth Defects Epidemiology and Surveillance Branch, Texas Department of State Health Services, Austin, Texas
  4. Departments of Epidemiology and Nutrition, University of North Carolina School of Public Health, Chapel Hill, North Carolina
  5. Department of Pediatrics, Division of Neonatal and Developmental Medicine, Stanford University School of Medicine, Palo Alto, California

“Brazil’s birth-defects puzzle, Zika virus might not be only factor in reported microcephaly surge.” By Declan Butler, 28 July 2016, Nature, Vol. 535, Page 475-6.

“Zika epidemic uncovers Brazil’s hidden birth defect problem,” by Alex Cuadros, March 1, 2016, Washington Post

Disease Transmission by Arthropods,” E. J. L. Soulsby and William R. Harvey, Science 176, no. 4039 (1972): 1153–1155.

“DDT: A Case Study in Scientific Fraud,” by J. Gordon Edwards, PhD entomology, Journal of American Physicians and Surgeons Volume 9 Number 3 Fall 2004, at http://www.jpands.org/vol9no3/edwards.pdf


To the Student who dreams of a Carbon free life

To the Student who is dreaming of a Carbon free life

  • First, sell your car, bicycle or other means of transportation – they were made using carbon based fuels, cars use fossil fuels and even crude handmade carts drawn by animals use and emit carbon (fodder – excrement & CO2). Even electric cars were made with carbon based fuels and use electricity from fossil fueled power plants.
  • Never buy or use solar panels or wind generators – they were produced using carbon based fuels and require fossil fueled power plants as back-up when sun and wind are absent.
  • Sell your house or give up your apartment – it was made by using carbon based fuels, uses fossil fuels to heat and cool, whether with carbon based electricity or directly from oil, gas, coal, wood. Never shelter from weather or use any heat in cold weather.
  • Sell your household goods – Chairs, tables, beds, sheets, towels, etc. – all were made using fossil fuels.
  • Sell your appliances and electronic gadgets – they were made using carbon based fuels and get their electricity from fossil fueled power plants.
  • Never drink purified water from a water system – pumps and purification all run on and were made using fossil fuels. Drink only “natural” water from streams, complete with parasites, bacteria and viruses.
  • Never buy or use any paper, plastic, cloth, wood, metal or glass products, including books and paper money, pens, pencils, dishes, pans, etc. –all are produced by using fossil fuels.
  • Never use any cleaning products, soap, cosmetics or shaving or hair care materials or implements – they were all made from and with carbon based fuels.
  • Remove and give away all of your clothes and shoes – they were made using fossil fuels, use water, detergents and electricity for cleaning and ironing.
  • Don’t buy food from stores – it was transported, processed and kept fresh using fossil fuels.
  • Never cook your food – it takes heat ultimately produced by carbon based fuels.
  • Stop eating – you are using carbon based foods and excrete carbon pollutants.
  • Stop breathing – you are emitting CO2.
  • Your short, miserable life is now over and your dead body is now polluting the planet.

Dreaming of Carbon Free Living?

To the Student who is dreaming of a Carbon free life

  • First, sell your car, bicycle or other means of transportation – they were made using carbon based fuels, cars use fossil fuels and even crude handmade carts drawn by animals use and emit carbon (fodder – excrement & CO2). Even electric cars were made with carbon based fuels and use electricity from fossil fueled power plants.
  • Never buy or use solar panels or wind generators – they were produced using carbon based fuels and require fossil fueled power plants as back-up when sun and wind are absent.
  • Sell your house or give up your apartment – it was made by using carbon based fuels, uses fossil fuels to heat and cool, whether with carbon based electricity or directly from oil, gas, coal, wood. Never shelter from weather or use any heat in cold weather.
  • Sell your household goods – Chairs, tables, beds, sheets, towels, etc. – all were made using fossil fuels.
  • Sell your appliances and electronic gadgets – they were made using carbon based fuels and get their electricity from fossil fueled power plants.
  • Never drink purified water from a water system – pumps and purification all run on and were made using fossil fuels. Drink only “natural” water from streams, complete with parasites, bacteria and viruses.
  • Never buy or use any paper, plastic, cloth, wood, metal or glass products, including books and paper money, pens, pencils, dishes, pans, etc. –all are produced by using fossil fuels.
  • Never use any cleaning products, soap, cosmetics or shaving or hair care materials or implements – they were all made from and with carbon based fuels.
  • Remove and give away all of your clothes and shoes – they were made using fossil fuels, use water, detergents and electricity for cleaning and ironing.
  • Don’t buy food from stores – it was transported, processed and kept fresh using fossil fuels.
  • Never cook your food – it takes heat ultimately produced by carbon based fuels.
  • Stop eating – you are using carbon based foods and excrete carbon pollutants.
  • Stop breathing – you are emitting CO2.
  • Your short, miserable life is now over and your dead body is now polluting the planet.


AGW Claims vs Truth: Claim 9 Oceans are more acidic due to increased CO2

Ocean_park_wikiClaim 9: The oceans are becoming more acidic due to the increased CO2 and erosion of carbonate rocks by acidified rain, so that corals and other animals are being harmed or killed.

Truth: This is partially true, but not to the extent that is claimed. The oceans are naturally alkaline (non-acidic) and are buffered by minerals and by the activities of biological systems. (See below for explanations of pH and buffering.) The normal pH of the oceans is in the range of 8.1. Like the manmade global warming hypothesis and the progressive nitrogen limitation hypothesis, (see Claim 2b), the ocean acidification hypothesis is a model scenario based on theory, not real experimental data. The models in the IPCC reports project a maximum reduction in pH of 0.3 by 2100. They also claim that a reduction of pH will slow the growth rate of coral or worse. So, are the corals and shelled creatures in danger? Hardly.

These models use a purely geochemical approach and do not take into account the effect of living systems on pH. For example, photosynthesis is known to increase pH. Increased algae growth rate from increased CO2 can offset any drop in pH.  There is a temporary seasonal variation in pH from such processes that is greater than the projected pH changes from CO2[1]. Real experiments by bubbled CO2 through ocean water don’t result in the same pH changes projected by the models. In these experiments, no net negative effect on coral growth is seen even with actual acidification by adding hydrochloric acid. As a matter of fact, in these experiments a slight reduction in pH may have been beneficial.

As stated in Claim 2, item d, CO2 is less soluble in warmer water so temperature also affects pH. Warmer water means less CO2 is dissolved in it by giving off more CO2 to the atmosphere. A lower concentration of CO2 with warming should, if anything, raise the pH (less acid) not lower it (more acid). However, due to buffering, no net change in overall pH has been found other than temporary localized variations from other processes like photosynthesis and agricultural run-off.

CO2 becomes carbonic acid (HCO3 and H2CO3) in water. H2O + CO2 = H2CO3, a very weak acid, some of which splits to form HCO3 ions and H+. The free H+ is what erodes carbonate (CO3=) rocks. For example,  insoluble CaCO3 + H+ = Ca++ + HCO3 (both soluble).

 Understanding pH:

pH is a measure of the hydrogen ion (H+) concentration in a water solution. The more hydrogen ions there are the more acid the solution is.  However, pH is the negative log of hydrogen ion concentration, so that the higher the concentration, the lower the pH number. For example, a pH of 5 is a hydrogen ion concentration of 10-5. A pH of 8 is a hydrogen ion concentration of 10-8. With less hydrogen ions, the hydroxyl ions from water make the solution “basic” or alkaline. 10-5 = 0.00001 or 0.001 percent. 10-8 = 0.00000001 or 0.000001 percent. So pH 5 is 1000 times the hydrogen ion concentration of pH 8. Neutral water is pH 7 with equal amounts of hydrogen ions and hydroxyl ions.

Understanding buffering:

When water is buffered, it has at least two related molecules or ions in balance that resist changes in pH of the solution by changing their ionic state when acids or bases are added or when diluted. Any added hydrogen ions from a more acidic solution causes a change in the ratio of the two buffer species offsetting any tendency to change pH. Water exposed to the atmospheric carbon dioxide is never neutral pH 7. It is in the range of pH 5.4. Oceans are in the range of pH 8 so it is obvious that the oceans are “buffered” against changes in pH by rain that is naturally more acidic. Biological systems and a complex mixture of buffering molecules/ions contribute to the buffering of oceans and other bodies of water, so that pH remains relatively steady over long periods of time under various stresses from sources ranging from acid rain to volcanoes.

Example: CO2 combines with water to form one of three forms of carbonate/-ic depending on the direction the pH is being pushed. These reactions can go back and forth between species as needed to maintain a constant pH.

CO2 + H2O <=> H2CO3 <=>  H+ + HCO3_ < => CO3= + 2H+

carbonic acid      bicarbonate ion      carbonate ion

The CO2 to carbonate series is one of the most important buffer systems in the oceans and is supplemented by carbonate in its various forms from erosion of rock. This example is simplified for clarity by leaving out other ions that affect pH such as Calcium, Magnesium, sodium, chlorine and sulfite (Ca++, Mg++, Na+, Cl, SO3=). Chemicals produced by living organisms also affect buffering and overall pH.

[1] “Marine Photosynthesis and Oceanic pH,” Sherwood, Keith and Craig Idso, CO2 Science (online journal), Volume 10, Number 34: 22 August 2007 http://www.co2science.org/articles/V10/N34/EDIT.php Center for the Study of Carbon Dioxide and Global Change


Stanford Universities Paul Ehrlich Wanted To Poison Black Africans To Fight Climate Change

Stanford Universities Paul Ehrlich Wanted To Poison Black Africans To Fight Climate Change

Giving society cheap, abundant energy would be the
equivalent of giving an idiot child a machine gun
.”
– Prof Paul Ehrlich, Stanford University

•••

Stanford Universities population freak and climate catastrophist Paul Ehrlich recently featured as a guest on ABC Australia’s popular “Q and A” current affairs hour.

“Q and A’s” proud boast, popular with its majority Leftist audience, is being champions of equality, compassion and to strictly condemn, name and shame those who fit a predetermined racist bent. I.e conservatives.

That said, did any panel members or audience question Ehrlich about his preference to which colour should be eliminated first?

I thought “Black-Lives-Matter” or is that simply another victomhood slogan designed by the Left to divide and silence?

Screen Shot 2016-04-24 at , April 24, 8.18.18 AM.png

GST, Gonski, Population and Diversity | Q&A | ABC TV

•••

Stanford Universities Paul R. Ehrlich via Steve Goddard’s Real Science:

Ehrlich Wanted To Poison Africans In Order To Control His Own Neurosis

http://select.nytimes.com

The Evening News – Google News Archive Search

Notable comments from Climate Change / Global Warming fear-monger and population freak Paul Ehrlich :

  • “Giving society cheap, abundant energy would be the equivalent of giving an idiot child a machine gun.” – Malthusian, eco-alarmist Paul R. Ehrlich in The American Spectator, September 6, 1992
  • “In ten years all important animal life in the sea will be extinct. Large areas of coastline will have to be evacuated because of the stench of dead fish.” – Paul R. Ehrlich, Earth Day 1970
  • “The battle to feed humanity is over. In the 1970s the world will undergo famines . . . hundreds of millions of people (including Americans) are going to starve to death.” – Paul R. Ehrlich (Population Bomb 1960)
  • “I would take even money that England will not exist in the year 2000.” – Paul R. Ehrlich (1969)
  • “By 1985 enough millions will have died to reduce the earth’s population to some acceptable level, like 1.5 billion people.” – Paul R. Ehrlich (1969)
  • “We’ve already had too much economic growth in the United States. Economic growth in rich countries like ours is the disease, not the cure.” – Paul R. Ehrlich. Quoted by Dixy Lee Ray in her book Trashing the Planet (1990)

Alarmist Paul R. Ehrlich now works for The Royal Society, (to bolster their credibility /sarc) ~ “Nullius In Verba”

https://climatism.wordpress.com/2016/04/24/stanford-universities-paul-ehrlich-wanted-to-poison-black-africans-to-fight-climate-change/


Jamie Spry's avatarClimatism

Giving society cheap, abundant energy would be the
equivalent of giving an idiot child a machine gun
.”
– Prof Paul Ehrlich, Stanford University

•••

Stanford Universities population freak and climate catastrophist Paul Ehrlich recently featured as a guest on ABC Australia’s popular “Q and A” current affairs hour.

“Q and A’s” proud boast, popular with its majority Leftist audience, is being champions of equality, compassion and to strictly condemn, name and shame those who fit a predetermined racist bent. I.e conservatives.

That said, did any panel members or audience question Ehrlich about his preference to which colour should be eliminated first?

I thought “Black-Lives-Matter” or is that simply another victomhood slogan designed by the Left to divide and silence?

Screen Shot 2016-04-24 at , April 24, 8.18.18 AM.png

GST, Gonski, Population and Diversity | Q&A | ABC TV

•••

Stanford Universities Paul R. Ehrlich via Steve Goddard’s Real Science:

Ehrlich Wanted To Poison Africans In Order To Control…

View original post 396 more words

AGW Claims vs Truth – Claim 8: The world is in danger of catastrophic consequences – sea level rise, polar ice and glaciers melting, growing deserts, worse storms, droughts and floods

Claim 8: The world is in danger of catastrophic consequences of global warming such as sea level rise, polar ice and glaciers melting, growing deserts, worse storms, droughts and floods.

 Truth: a.) Sea levels have been rising along with warming since the Little Ice Age at an average rate of 7 inches per century due to glacier melting and expansion of seawater with warming. This rate has not changed significantly in recent times. To claim that sea levels have risen, the IPCC used a tide gauge in Hong Kong that showed tide levels rising, not because of sea level rising, but because the land is sinking (subsiding).  Those islands that were supposedly in danger of being swamped have had almost no net sea level rise in all the years since the early predictions. Globally, some land has been lost due to sea level rise and subsidence, but more land has been gained by other forces.

Sea Level Rise since the Little Ice Age

Source: “Environmental Effects of Increased Atmospheric Carbon Dioxide”[1]  Note that it is not correlated to fossil fuel consumption

b.) Polar ice caps have shrunk and grown in recent years but overall they have remained relatively unchanged since preindustrial times. The media hype is about a theory that the Larsen Ice Shelf (in the more northerly Western Antarctica peninsula) might break away from Antarctica, causing rapid sea level rise of 5 meters (16.4 ft.). Although a part broke away in 1995, most experts say rapid collapse will not happen and any collapse and sea level rise would occur over centuries[2]. Both sea ice and ice cover have grown even more in other, more southerly locations on the continent. This year northern polar sea ice was thicker than usual so that there was some concern that the polar bears might have a harder time finding seals to eat. By the way, polar bear populations have been increasing in recent years.

c.) Glaciers have been receding since the Little Ice Age at a relatively steady pace that, along with water expansion with warming, accounts for much of the sea level rise. Melting of floating sea ice doesn’t cause a rising sea level. It is already displacing its weight in saltwater. Ice expands as it freezes, so that melt water shrinks as it melts, resulting in the release of the same weight of water as was originally displaced. Only land-based glaciers will have any effect on sea level. While most glaciers are receding, there are some that are actually growing.

CO2 Increase since 1950 does not track Glacier Shortening

Source: “Environmental Effects of Increased Atmospheric Carbon Dioxide”[3]

d.) Droughts have not increased in recent times. Some years are worse than others, but the overall picture has not changed.

Global drought monitoring - nature
Global drought monitoring

Global Drought: Fraction of the global land in D0 (abnormally dry), D1 (moderate), D2 (severe), D3 (extreme), and D4 (exceptional) drought condition (Data: Standardized Precipitation Index data derived from MERRA-Land)[4]

e.) Deserts are generally a result of geographic barriers and over grazing. Most of the Sahara Desert was once a grassy plain where livestock were grazed. It is a naturally dry area due to mountains to the west that block much of the moisture from the Atlantic Ocean. Overgrazing and loss of denuded top soil by winds had contributed to its expansion long before the industrial age. In most areas of the world, there has been no marked increase in the rate of desertification in recent times. Instead, deserts are greening as a result of higher CO2 levels that increase growth rates and make plants more tolerant of dry conditions by reducing the leaf pores. See previous post AGW Claims 2b The Benefits of Carbon Dioxide, answer c.

f.) Storms have not gotten worse. The dollar damages in some areas have increased due to increased urbanization, but not the severity of the storms themselves. The number of tornados has actually declined in the United States and their severity has not increased. The same is true of hurricanes and in recent years few have made landfall in the United States.

US Annual Severe Tornados

[1] Review Article: “Environmental effects of increased atmospheric carbon dioxide,” Willie Soon, Sallie L. Baliunas, Arthur B. Robinson, Zachary W. Robinson, Climate Res. 13, 149-164, (1999)

[2] Quote: “More realistically, ice-shelf deterioration is likely to be a rather slow process, and even for a major and sustained warming trend ice-sheet collapse would take several hundred years, with most of the associated rise in sea level occurring during the final century.” From Nature 277, 355 – 358 (01 February 1979); doi:10.1038/277355a0 “Effect of climatic warming on the West Antarctic ice sheet Robert H. Thomas1.), Timothy J. O. Sanderson2.) & Keith E. Rose3.) from 1.) Institute for Quaternary Studies, University of Maine at Orono, Orono, Maine 04469, 2.) British Antarctic Survey, Cambridge, UK, 3.)Scott Polar Research Institute, Cambridge, UK Present address: Department of Geophysics, Royal School of Mines, Imperial College, London SW7, UK http://www.nature.com/nature/journal/v277/n5695/abs/277355a0.html

[3] Reference: ”Extracting a Climate Signal from 169 Glacier Records,” J. Oerlemans, Institute for Marine and Atmospheric Research, Utrecht University, Princetonplein 5, 3584 CC Utrecht, Netherlands. Science 29 April 2005: Vol. 308, 675-677, doi: 10.1126/science.1107046.

[4] “Global integrated drought monitoring and prediction system,” Aengchao Hao, Amir AghaKouchak, Navid Nakhjiri, Alireza Farahmand, Nature, Scientific Data 1, Article number 140001 (2914), doi:10,1038/sdata.2014.1


AGW Claims vs. Truth – Claim 7. Temperatures have risen faster in recent years than ever before


082015_1920_1.png
Average Global Temperatures vs Number of Reporting Stations

Truth: Remember that there is no such thing as a global temperature. It is the average of all of the reporting stations all over the world. For example, several years ago Ross McKitrick[1] using CRU data showed that the rapid rise in temperatures in the 1990s directly coincided with a decrease in the number of Siberian weather stations reporting due to the break-up of the Soviet Union.

Additionally, the “hottest year on record,” 1998, was an El Nino year so it was naturally hotter than the years just before and after. Another cause of rising average global temperatures is the urban heat island effect. Cities are hotter than rural areas.

Many of the reporting stations that were once in undeveloped rural areas have experienced either suburban or urban development, or the stations have been moved to more urban settings. It is well documented that some have been, seemingly intentionally, relocated near or at heat sources such as paved parking lots and air conditioners.Urban Heat 1 One reason for relocation near buildings or other structures could be that new automatic-reporting equipment needs to be connected by cable. Rather than dig up parking lots or roads to install units in a grassy or protected area, many have opted to locate them where they can be directly connected without involving costly excavation, although such sites do not meet the stated requirements.

Urban Heat 5
Rating system for locating weather stations

Instead of excluding data from stations that are poorly situated, a convoluted mathematical algorithm (scheme) is used to “correct” it to presumed pre-industrial levels. In spite of all this, it appears that there has been no net warming since the late 1990s and even a slight cooling since 2005. One other problem with the new equipment is that it has a faster response time that records brief, transient signals such as car or plane exhausts that were not picked up by the older equipment. Because the equipment is designed to report maximum and minimum temperatures, this can create a false result.

Urban Heat 6
Urban Locations
Urban Heat 8
Plus Correction Algorithms
100_0070B
“equals” pristine natural setting


[1] Ross McKitrick, Professor of Economics and CBE Chair in Sustainable Commerce, University of Guelph, Guelph, Ontario, Canada http://www.rossmckitrick.com

AGW Claims vs Truth – Claim 6. Temperatures are hotter than in the last 100,000 years

Global Temperatures 2500 BC to 2040 AD

Claim 6. Temperatures are hotter now than they have been in the last 100,000 years

Truth: This is clearly an unsubstantiated myth meant to scare people into compliance with drastic environmental regulations.  The climate modelers have eliminated the Medieval Warm Period, which was hotter than it is today, and it was a time of prosperity. It was hotter in the 1930s than it is today. However, the American “Dust Bowl” of the 1930s was not due to warming. It was caused by opening up vast areas to farming that were poorly suited to it and a years-long severe drought. Based on historical accounts, ice cores and tree rings, modelers have dismissed the Medieval Warm Period and the Little Ice Age by claiming that they were not global phenomena but were limited to Europe and North America. More recent and more detailed ice core studies, etc. have shown that both of these periods were indeed global. Over the last 100,000 years, temperatures have been far hotter and far colder than the present.  Who can say what “normal” global temperature is when it is always changing?  Should we attempt to freeze the present day conditions as the ideal, or should we take a more reasonable approach to an ever changing climate?

15 climate chart - 11K yrs vs CO2
11,000 year record of Temperatures vs. CO2