Wind power sits comfortably alongside Alchemy and perpetual motion machines: ideas that were both superficially attractive and utterly impossible. No country has ever powered itself entirely with wind power, and no country ever will. Putting aside their unreliability and chaotic intermittency, the amount of energy and resources that go into building a single wind turbine […]
By Paul Homewood Not only is the UK Met Office desperate to declare a new record temperature from an extremely dodgy site in Cambridge, but a newly claimed record temperature in Germany also appears to be a cheat: During last week’s record-setting European heat wave, Germany’s previous record of 40.3C was impressively […]
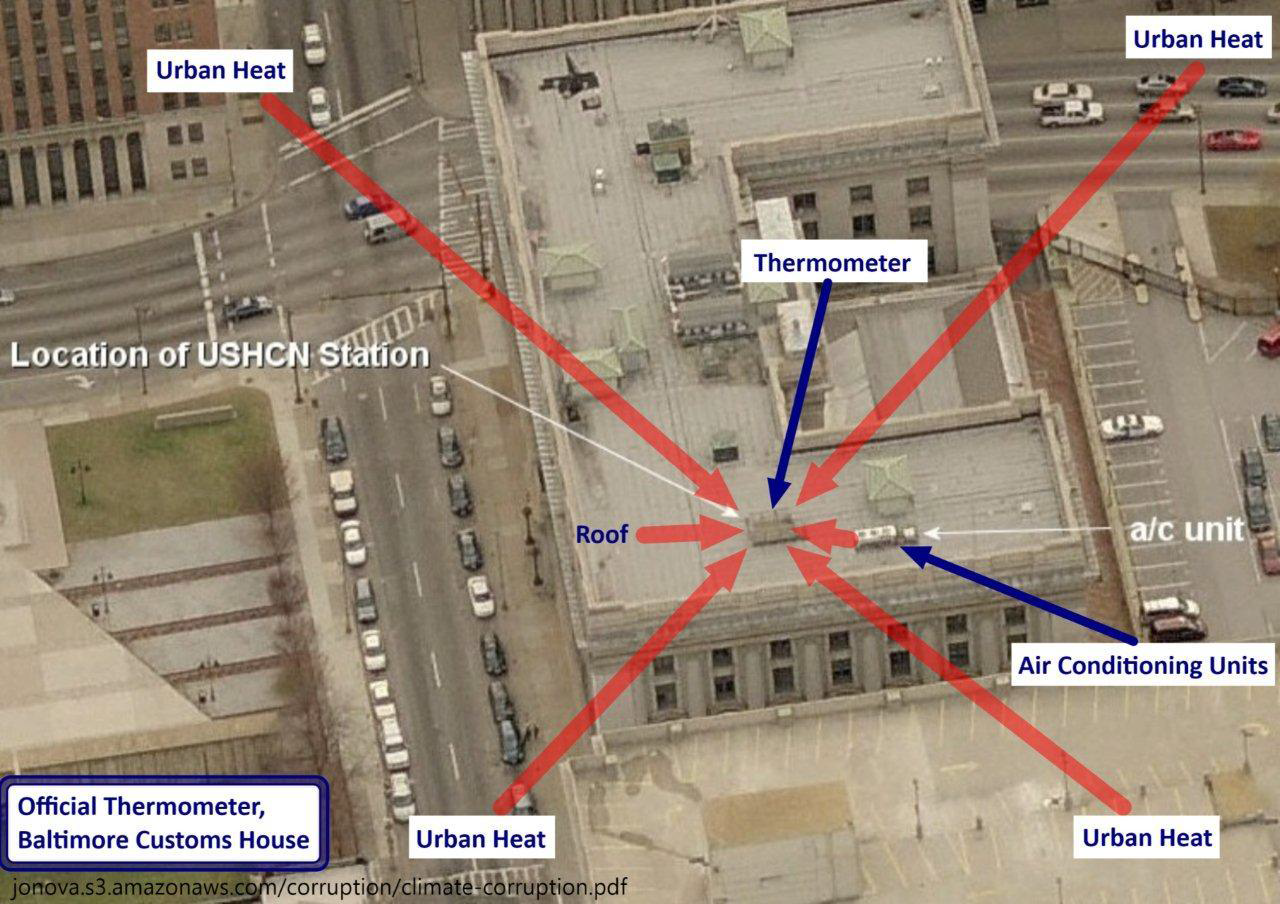
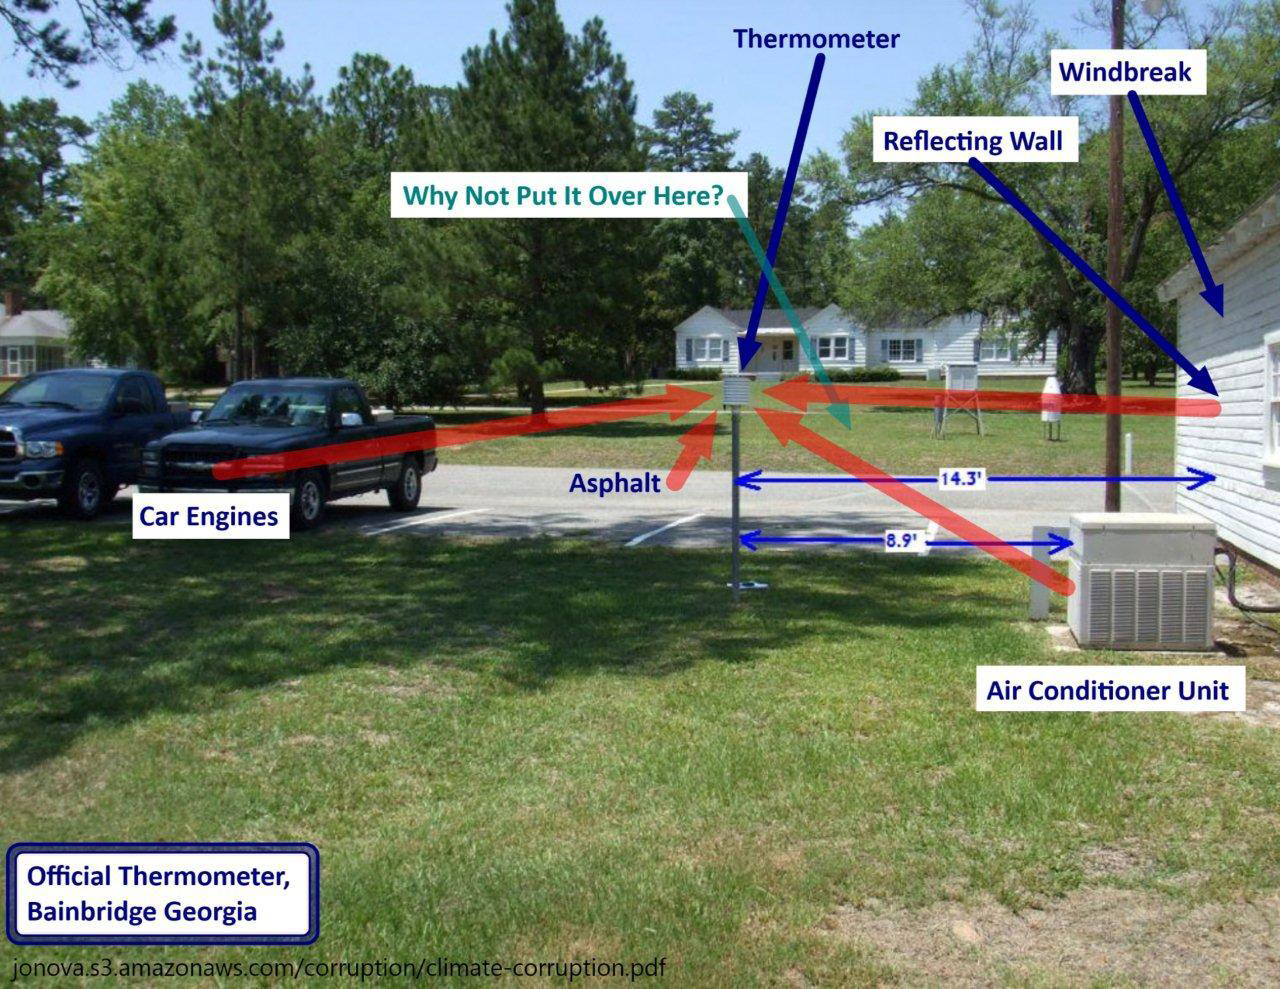
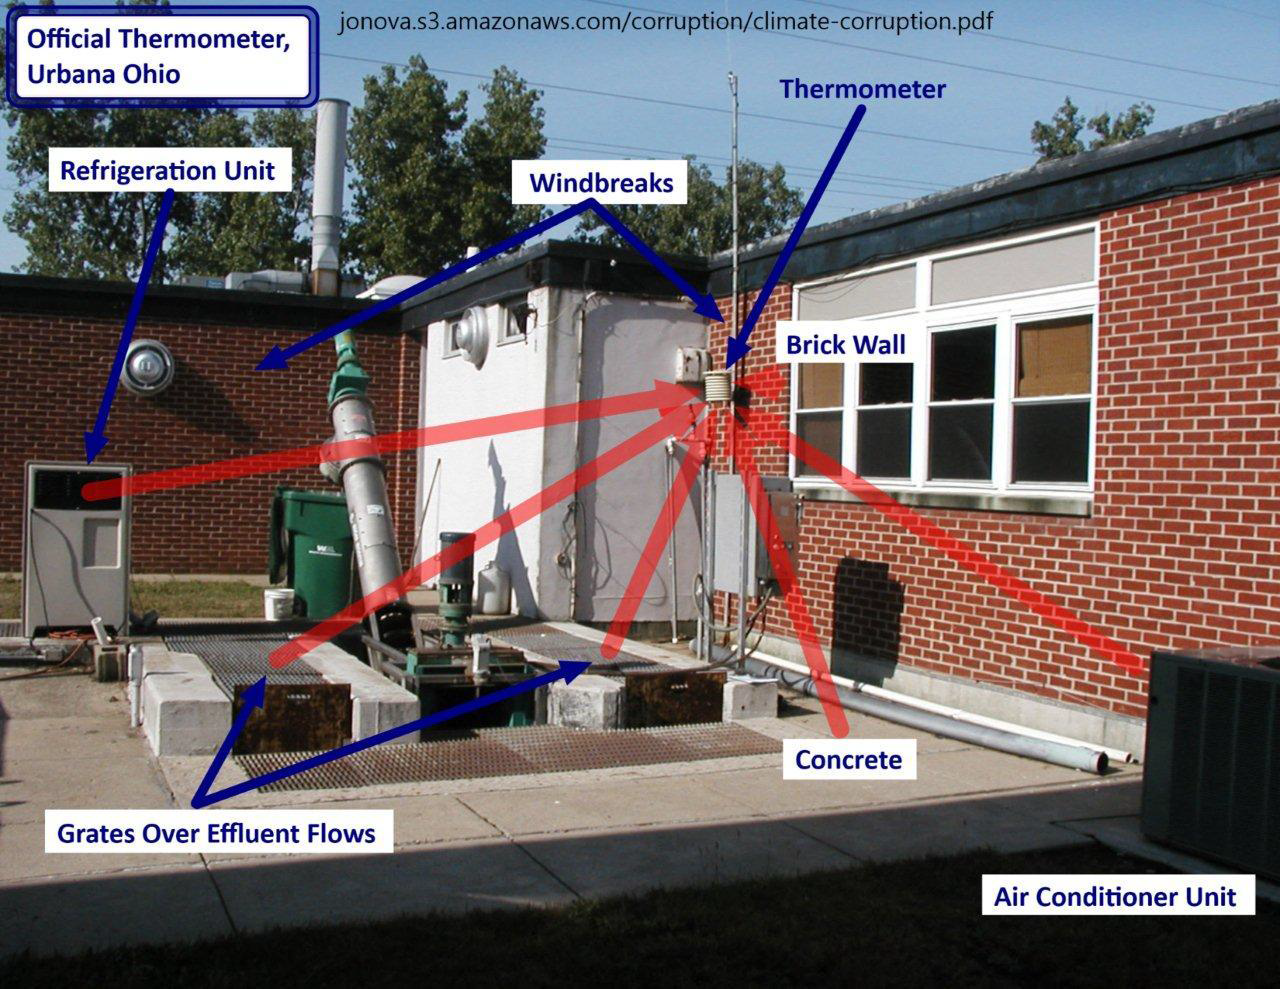
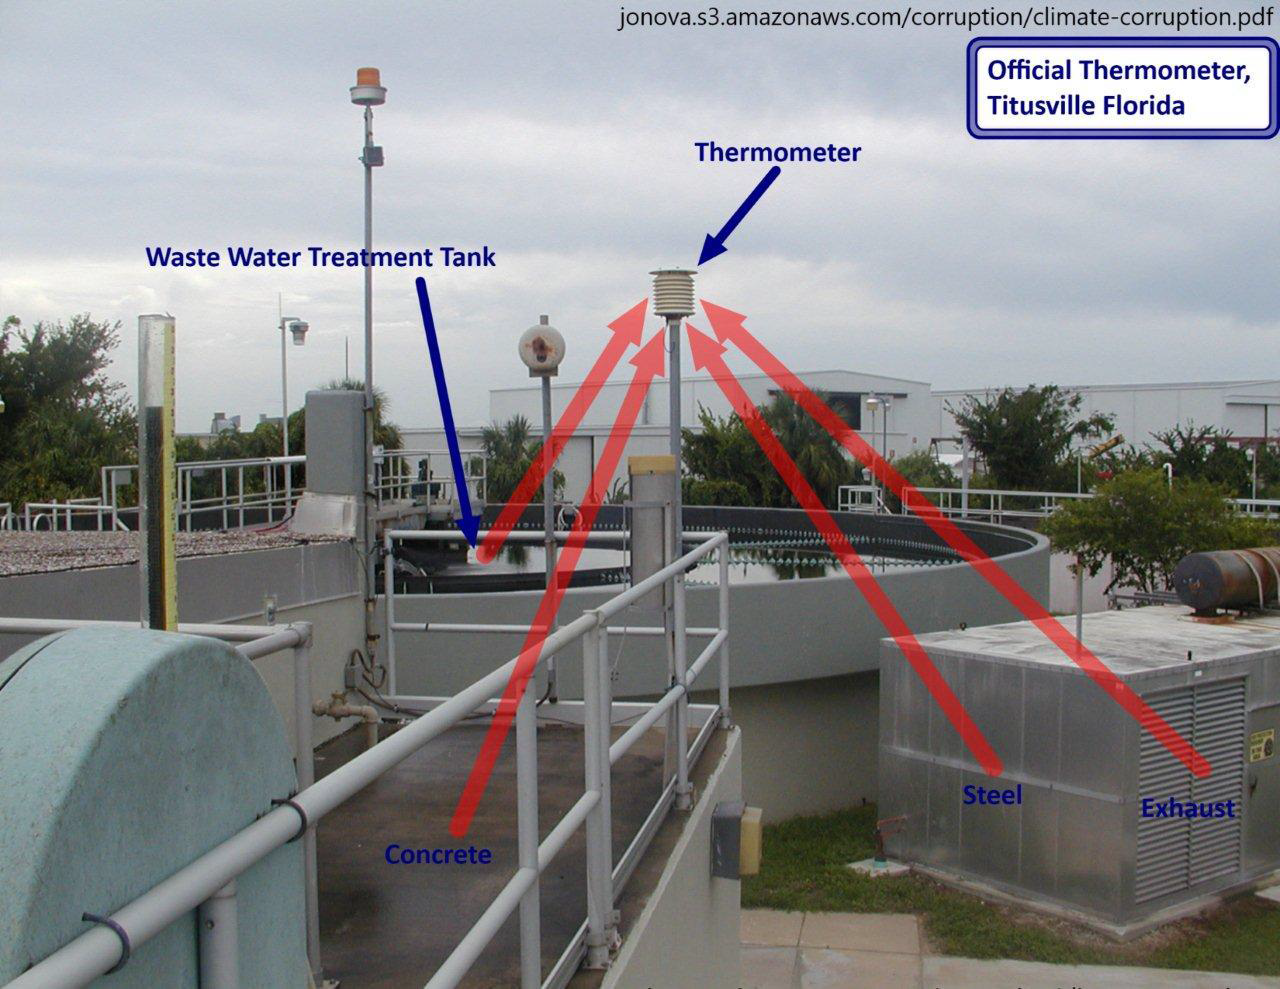
. . . One “cause” of rising average global temperatures is the urban heat island effect. Cities are hotter than rural areas. Many of the reporting stations that were once in undeveloped rural areas have experienced either suburban or urban development, or the stations have been moved to more urban settings. It is well documented that some have been, seemingly intentionally, relocated near or at heat sources such as paved parking lots and air conditioners.
One reason for relocation near buildings or other structures could be that new automatic-reporting equipment needs to be connected by cable. Rather than dig up parking lots or roads to install units in a grassy or protected area, many have opted to locate them where they can be directly connected without involving costly excavation, although such sites do not meet the stated requirements. Instead of excluding data from stations that are poorly situated, a convoluted mathematical algorithm (scheme) is used to “correct” it to presumed pre-industrial levels. See illustrations below.
One additional problem with the newer sensors is their fast response. Since they record the high and low temperature point each day, not the average, they can report a transient heat source like a passing bus, an idling auto or jet engine exhaust at the airport instead of the actual ambient temperature.
Actual Conditions are run through a algorithm (below)Example flow chart of algorithms used to correct actual dataCorrected data approximated by algorithm
Urban area plus mathematical correction algorithm equals pristine nature
Source: “The Influence of anthropic surface processes and inhomogeneities on gridded global climate data” Slide 21, Powerpoint presentation to the American Chemical Society, Denver CO via Webinar, August 28 2011 by Ross McKitrick, Department of Economics, University of Guelph, Guelph ON Canada http://www.rossmckitrick.com/general-overviews.html
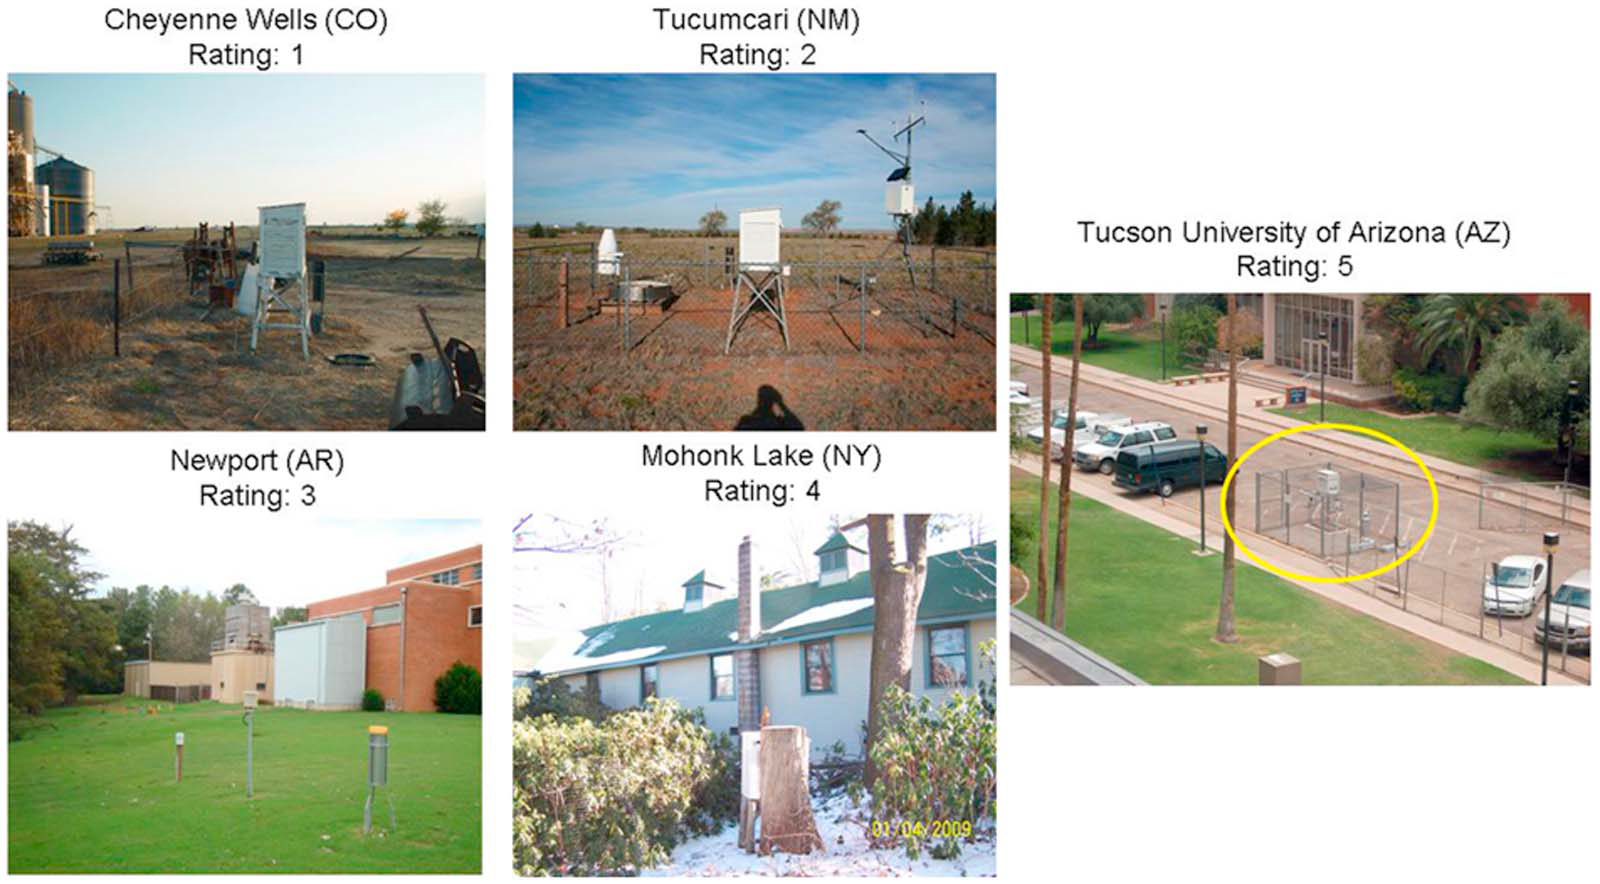
Proposed rating of reporting stations with regard to surroundings:
Figure 3. U.S. Historical Climate Network (USHCN) station exposure at sites representative of each CRN class: CRN 1, a clear flat surface with sensors located at least 100 m from artificial heating and vegetation ground cover <10 cm high; CRN 2, same as CRN 1 with surrounding vegetation <25 cm and artificial heating sources within 30 m; CRN 3, same as CRN 2, except no artificial heating sources within 10 m; CRN 4, artificial heating sources <10 m; and CRN 5, sensor located next to/above an artificial heating source.
Source: “Analysis of the impacts of station exposure on the U.S. Historical Climatology Network temperatures and temperature trends,” Souleymane Fall,Anthony Watts,John Nielsen‐Gammon,Evan Jones,Dev Niyogi,John R. Christy,5and Roger A. Pielke Sr., Journal of Geophysical Research, Vol. 116, D116, D14120 doi:10.1029/2010JD015146, 2011
See other examples below of poor placement of temperature reporting stations from “Is the Western Climate Establishment Corrupt?” The public might not understand the science, but they do understand cheating, Dr. David Evans, 11 Nov 2010 (last updated 28 Feb 2011) Web Address: jonova.s3.amazonaws.com/corruption/climate-corruption.pdf
Guest essay by Eric Worrall Genius cartoonist Scott Adams published a Sunday cartoon panel offensive to the climate religion. From “Climate Change ” is the new universal boogeyman department. Just in case you think this cartoon is too ridiculous to be true, there are plenty of real world examples of people trying to blame climate…
No country has ever powered itself entirely with wind and solar. No country ever will. The image above is not the crazed doodlings of a maniac, it’s the combined output of every wind turbine connected to Australia’s Eastern Grid last month thanks to Aneroid Energy. Note the numerous occasions when output plummets by 2-3,000MW in minutes, […]
Spot the Vested Interest: The $1.5 Trillion Climate Change Industry – from JoNova website
Climate Change Business Journal estimates the Climate Change Industry is a $1.5 Trillion dollar escapade, which means four billion dollars a day is spent on our quest to change the climate. That includes everything from carbon markets to carbon consulting, carbon sequestration, renewables, biofuels, green buildings and insipid cars. For comparison global retail sales online are worth around $1.5 trillion. So all the money wasted on the climate is equivalent to all the goods bought online.
The special thing about this industry is that it wouldn’t exist if it weren’t for an assumption about relative humidity that is probably wrong. As such, it’s the only major industry in the world dependent on consumer and voter ignorance. This is not just another vested interest in a political debate; it’s vested-on-steroids, a mere opinion poll away from extinction. You can almost hear the captains of climate industry bellowing: “Keep ‘em ignorant and believing, or the money goes away!”.
To state the obvious:
Policy, or the anticipation of new policy, has been one of the biggest drivers of the industry, the report shows.
Most industries this size exist because they produce something the market wants. They worry that competitors might chip into their market share, but they don’t worry that the market might disappear overnight. Normal industries fear that a “bad” political outcome might reduce profits by ten or twenty percent, and sometimes they donate “both ways”. But the climate industry has literally a trillion on the table that depends on big-government policy and election outcomes. They are always one prime-time documentary away from disaster. What if the public saw that thermometers were next to industrial exhaust vents? What if they learned that the climate models are unskilled, broken, and non-functional, or that 28 million weather balloons show carbon reduction is fruitless pursuit? What if they knew historic records are wildly adjusted to make the current weather look warmer than it would? …
Josh comes through with another cartoon. In case you missed it, over the weekend, Willis Eschenbach published “Planet-Sized Experiments – we’ve already done the 2°C test” One of the truths in that article was directed at this past weekend’s “climate strikes”, inspired by 16 year old Greta Thunberg. Willis makes a lot of sense with…
Nicholas Lewis gave a keynote lecture with the Title “How sensitive is the climate to greenhouse gases?” – Is it really necessary to reach zero emissions in 2050? At our “Ontgroeningsdag” event on 7 March 2019 in Amsterdam. Video follows.
First they came for the coal industry, now for oil and gas: West Australian EPA decides state must meet “Paris” alone, by Joanne Nova. Suddenly, with five minutes warning, Western Australia may be going it alone to meet Paris on behalf of Australia. Not because an elected government decided that, but because of five people […]