To the Student who is dreaming of a Carbon free life
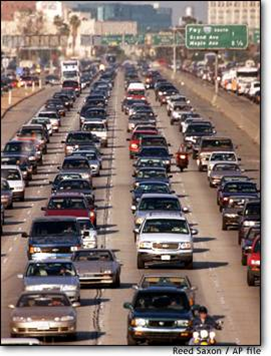
First, sell your car, bicycle or other means of transportation – they were made using carbon based fuels, cars use fossil fuels and even crude handmade carts drawn by animals use and emit carbon (fodder – excrement & CO2). Even electric cars were made with carbon based fuels and use electricity from fossil fueled power plants.
Never buy or use solar panels or wind generators – they were produced using carbon based fuels and require fossil fueled power plants as back-up when sun and wind are absent.
Sell your house or give up your apartment – it was made by using carbon based fuels, uses fossil fuels to heat and cool, whether with carbon based electricity or directly from oil, gas, coal, wood. Never shelter from weather or use any heat in cold weather.
Sell your household goods – Chairs, tables, beds, sheets, towels, etc. – all were made using fossil fuels.
Sell your appliances and electronic gadgets – they were made using carbon based fuels and get their electricity from fossil fueled power plants.
Never drink purified water from a water system – pumps and purification all run on and were made using fossil fuels. Drink only “natural” water from streams, complete with parasites, bacteria and viruses.
Never buy or use any paper, plastic, cloth, wood, metal or glass products, including books and paper money, pens, pencils, dishes, pans, etc. –all are produced by using fossil fuels.
Never use any cleaning products, soap, cosmetics or shaving or hair care materials or implements – they were all made from and with carbon based fuels.
Remove and give away all of your clothes and shoes – they were made using fossil fuels, use water, detergents and electricity for cleaning and ironing.
Don’t buy food from stores – it was transported, processed and kept fresh using fossil fuels.
Never cook your food – it takes heat ultimately produced by carbon based fuels.
Stop eating – you are using carbon based foods and excrete carbon pollutants.
Stop breathing – you are emitting CO2.
Your short, miserable life is now over and your dead body is now polluting the planet.
To the Student who is dreaming of a Carbon free life
First, sell your car, bicycle or other means of transportation – they were made using carbon based fuels, cars use fossil fuels and even crude handmade carts drawn by animals use and emit carbon (fodder – excrement & CO2). Even electric cars were made with carbon based fuels and use electricity from fossil fueled power plants.
Never buy or use solar panels or wind generators – they were produced using carbon based fuels and require fossil fueled power plants as back-up when sun and wind are absent.
Sell your house or give up your apartment – it was made by using carbon based fuels, uses fossil fuels to heat and cool, whether with carbon based electricity or directly from oil, gas, coal, wood. Never shelter from weather or use any heat in cold weather.
Sell your household goods – Chairs, tables, beds, sheets, towels, etc. – all were made using fossil fuels.
Sell your appliances and electronic gadgets – they were made using carbon based fuels and get their electricity from fossil fueled power plants.
Never drink purified water from a water system – pumps and purification all run on and were made using fossil fuels. Drink only “natural” water from streams, complete with parasites, bacteria and viruses.
Never buy or use any paper, plastic, cloth, wood, metal or glass products, including books and paper money, pens, pencils, dishes, pans, etc. –all are produced by using fossil fuels.
Never use any cleaning products, soap, cosmetics or shaving or hair care materials or implements – they were all made from and with carbon based fuels.
Remove and give away all of your clothes and shoes – they were made using fossil fuels, use water, detergents and electricity for cleaning and ironing.
Don’t buy food from stores – it was transported, processed and kept fresh using fossil fuels.
Never cook your food – it takes heat ultimately produced by carbon based fuels.
Stop eating – you are using carbon based foods and excrete carbon pollutants.
Stop breathing – you are emitting CO2.
Your short, miserable life is now over and your dead body is now polluting the planet.
Claim 9: The oceans are becoming more acidic due to the increased CO2 and erosion of carbonate rocks by acidified rain, so that corals and other animals are being harmed or killed.
Truth: This is partially true, but not to the extent that is claimed. The oceans are naturally alkaline (non-acidic) and are buffered by minerals and by the activities of biological systems. (See below for explanations of pH and buffering.) The normal pH of the oceans is in the range of 8.1. Like the manmade global warming hypothesis and the progressive nitrogen limitation hypothesis, (see Claim 2b), the ocean acidification hypothesis is a model scenario based on theory, not real experimental data. The models in the IPCC reports project a maximum reduction in pH of 0.3 by 2100. They also claim that a reduction of pH will slow the growth rate of coral or worse. So, are the corals and shelled creatures in danger? Hardly.
These models use a purely geochemical approach and do not take into account the effect of living systems on pH. For example, photosynthesis is known to increase pH. Increased algae growth rate from increased CO2 can offset any drop in pH. There is a temporary seasonal variation in pH from such processes that is greater than the projected pH changes from CO2[1]. Real experiments by bubbled CO2 through ocean water don’t result in the same pH changes projected by the models. In these experiments, no net negative effect on coral growth is seen even with actual acidification by adding hydrochloric acid. As a matter of fact, in these experiments a slight reduction in pH may have been beneficial.
As stated in Claim 2, item d, CO2 is less soluble in warmer water so temperature also affects pH. Warmer water means less CO2 is dissolved in it by giving off more CO2 to the atmosphere. A lower concentration of CO2 with warming should, if anything, raise the pH (less acid) not lower it (more acid). However, due to buffering, no net change in overall pH has been found other than temporary localized variations from other processes like photosynthesis and agricultural run-off.
CO2 becomes carbonic acid (HCO3– and H2CO3) in water. H2O + CO2 = H2CO3, a very weak acid, some of which splits to form HCO3– ions and H+. The free H+ is what erodes carbonate (CO3=) rocks. For example, insoluble CaCO3 + H+ = Ca++ + HCO3– (both soluble).
Understanding pH:
pH is a measure of the hydrogen ion (H+) concentration in a water solution. The more hydrogen ions there are the more acid the solution is. However, pH is the negative log of hydrogen ion concentration, so that the higher the concentration, the lower the pH number. For example, a pH of 5 is a hydrogen ion concentration of 10-5. A pH of 8 is a hydrogen ion concentration of 10-8. With less hydrogen ions, the hydroxyl ions from water make the solution “basic” or alkaline. 10-5 = 0.00001 or 0.001 percent. 10-8 = 0.00000001 or 0.000001 percent. So pH 5 is 1000 times the hydrogen ion concentration of pH 8. Neutral water is pH 7 with equal amounts of hydrogen ions and hydroxyl ions.
Understanding buffering:
When water is buffered, it has at least two related molecules or ions in balance that resist changes in pH of the solution by changing their ionic state when acids or bases are added or when diluted. Any added hydrogen ions from a more acidic solution causes a change in the ratio of the two buffer species offsetting any tendency to change pH. Water exposed to the atmospheric carbon dioxide is never neutral pH 7. It is in the range of pH 5.4. Oceans are in the range of pH 8 so it is obvious that the oceans are “buffered” against changes in pH by rain that is naturally more acidic. Biological systems and a complex mixture of buffering molecules/ions contribute to the buffering of oceans and other bodies of water, so that pH remains relatively steady over long periods of time under various stresses from sources ranging from acid rain to volcanoes.
Example: CO2 combines with water to form one of three forms of carbonate/-ic depending on the direction the pH is being pushed. These reactions can go back and forth between species as needed to maintain a constant pH.
The CO2 to carbonate series is one of the most important buffer systems in the oceans and is supplemented by carbonate in its various forms from erosion of rock. This example is simplified for clarity by leaving out other ions that affect pH such as Calcium, Magnesium, sodium, chlorine and sulfite (Ca++, Mg++, Na+, Cl–, SO3=). Chemicals produced by living organisms also affect buffering and overall pH.
[1] “Marine Photosynthesis and Oceanic pH,” Sherwood, Keith and Craig Idso, CO2 Science (online journal), Volume 10, Number 34: 22 August 2007 http://www.co2science.org/articles/V10/N34/EDIT.php Center for the Study of Carbon Dioxide and Global Change
Claim 8: The world is in danger of catastrophic consequences of global warming such as sea level rise, polar ice and glaciers melting, growing deserts, worse storms, droughts and floods.
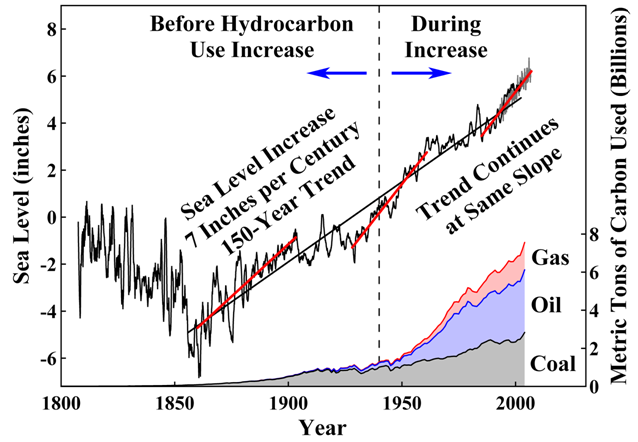
Truth: a.) Sea levels have been rising along with warming since the Little Ice Age at an average rate of 7 inches per century due to glacier melting and expansion of seawater with warming. This rate has not changed significantly in recent times. To claim that sea levels have risen, the IPCC used a tide gauge in Hong Kong that showed tide levels rising, not because of sea level rising, but because the land is sinking (subsiding). Those islands that were supposedly in danger of being swamped have had almost no net sea level rise in all the years since the early predictions. Globally, some land has been lost due to sea level rise and subsidence, but more land has been gained by other forces.
Sea Level Rise since the Little Ice Age
Source: “Environmental Effects of Increased Atmospheric Carbon Dioxide”[1] Note that it is not correlated to fossil fuel consumption
b.) Polar ice caps have shrunk and grown in recent years but overall they have remained relatively unchanged since preindustrial times. The media hype is about a theory that the Larsen Ice Shelf (in the more northerly Western Antarctica peninsula) might break away from Antarctica, causing rapid sea level rise of 5 meters (16.4 ft.). Although a part broke away in 1995, most experts say rapid collapse will not happen and any collapse and sea level rise would occur over centuries[2]. Both sea ice and ice cover have grown even more in other, more southerly locations on the continent. This year northern polar sea ice was thicker than usual so that there was some concern that the polar bears might have a harder time finding seals to eat. By the way, polar bear populations have been increasing in recent years.
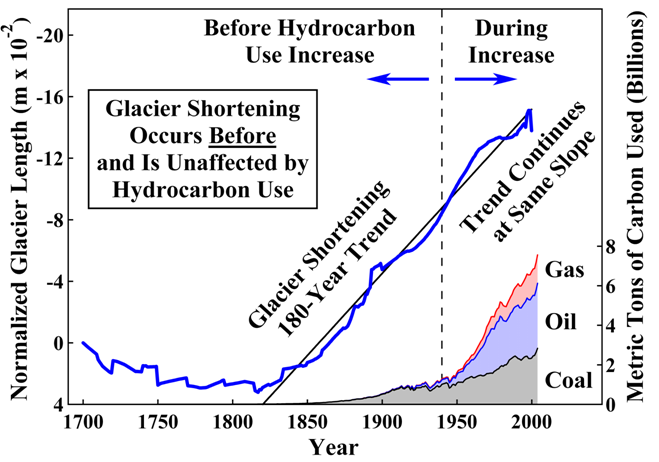
c.) Glaciers have been receding since the Little Ice Age at a relatively steady pace that, along with water expansion with warming, accounts for much of the sea level rise. Melting of floating sea ice doesn’t cause a rising sea level. It is already displacing its weight in saltwater. Ice expands as it freezes, so that melt water shrinks as it melts, resulting in the release of the same weight of water as was originally displaced. Only land-based glaciers will have any effect on sea level. While most glaciers are receding, there are some that are actually growing.
CO2 Increase since 1950 does not track Glacier Shortening
Source: “Environmental Effects of Increased Atmospheric Carbon Dioxide”[3]
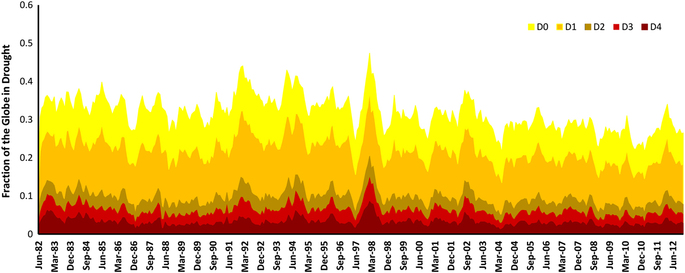
d.) Droughts have not increased in recent times. Some years are worse than others, but the overall picture has not changed.
Global drought monitoring
Global Drought: Fraction of the global land in D0 (abnormally dry), D1 (moderate), D2 (severe), D3 (extreme), and D4 (exceptional) drought condition (Data: Standardized Precipitation Index data derived from MERRA-Land)[4]
e.) Deserts are generally a result of geographic barriers and over grazing. Most of the Sahara Desert was once a grassy plain where livestock were grazed. It is a naturally dry area due to mountains to the west that block much of the moisture from the Atlantic Ocean. Overgrazing and loss of denuded top soil by winds had contributed to its expansion long before the industrial age. In most areas of the world, there has been no marked increase in the rate of desertification in recent times. Instead, deserts are greening as a result of higher CO2 levels that increase growth rates and make plants more tolerant of dry conditions by reducing the leaf pores. See previous post AGW Claims 2b The Benefits of Carbon Dioxide, answer c.
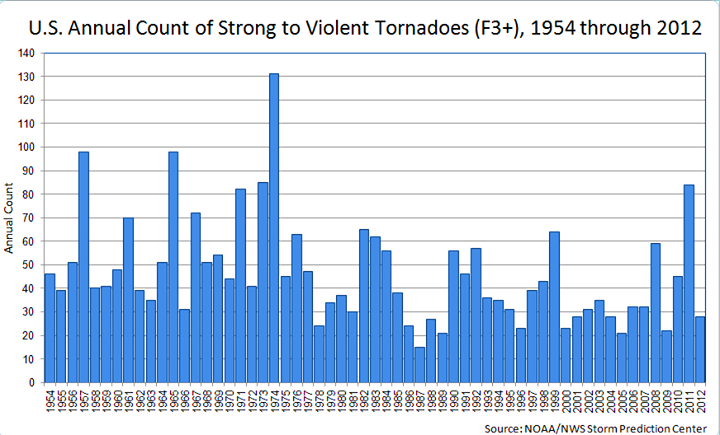
f.) Storms have not gotten worse. The dollar damages in some areas have increased due to increased urbanization, but not the severity of the storms themselves. The number of tornados has actually declined in the United States and their severity has not increased. The same is true of hurricanes and in recent years few have made landfall in the United States.
[1] Review Article: “Environmental effects of increased atmospheric carbon dioxide,” Willie Soon, Sallie L. Baliunas, Arthur B. Robinson, Zachary W. Robinson, Climate Res. 13, 149-164, (1999)
[2] Quote: “More realistically, ice-shelf deterioration is likely to be a rather slow process, and even for a major and sustained warming trend ice-sheet collapse would take several hundred years, with most of the associated rise in sea level occurring during the final century.” From Nature 277, 355 – 358 (01 February 1979); doi:10.1038/277355a0 “Effect of climatic warming on the West Antarctic ice sheet Robert H. Thomas1.), Timothy J. O. Sanderson2.) & Keith E. Rose3.) from 1.) Institute for Quaternary Studies, University of Maine at Orono, Orono, Maine 04469, 2.) British Antarctic Survey, Cambridge, UK, 3.)Scott Polar Research Institute, Cambridge, UK Present address: Department of Geophysics, Royal School of Mines, Imperial College, London SW7, UK http://www.nature.com/nature/journal/v277/n5695/abs/277355a0.html
[3] Reference: ”Extracting a Climate Signal from 169 Glacier Records,” J. Oerlemans, Institute for Marine and Atmospheric Research, Utrecht University, Princetonplein 5, 3584 CC Utrecht, Netherlands. Science 29 April 2005: Vol. 308, 675-677, doi: 10.1126/science.1107046.
[4] “Global integrated drought monitoring and prediction system,” Aengchao Hao, Amir AghaKouchak, Navid Nakhjiri, Alireza Farahmand, Nature, Scientific Data 1, Article number 140001 (2914), doi:10,1038/sdata.2014.1
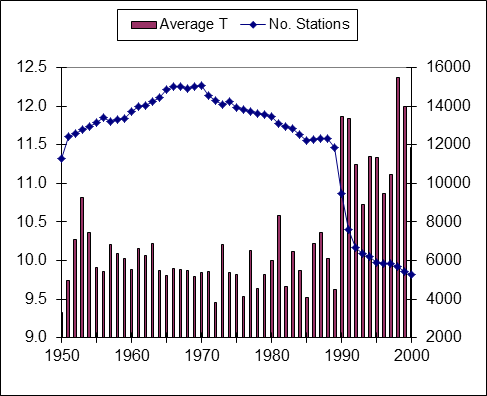
Average Global Temperatures vs Number of Reporting Stations
Truth: Remember that there is no such thing as a global temperature. It is the average of all of the reporting stations all over the world. For example, several years ago Ross McKitrick[1] using CRU data showed that the rapid rise in temperatures in the 1990s directly coincided with a decrease in the number of Siberian weather stations reporting due to the break-up of the Soviet Union.
Additionally, the “hottest year on record,” 1998, was an El Nino year so it was naturally hotter than the years just before and after. Another cause of rising average global temperatures is the urban heat island effect. Cities are hotter than rural areas.
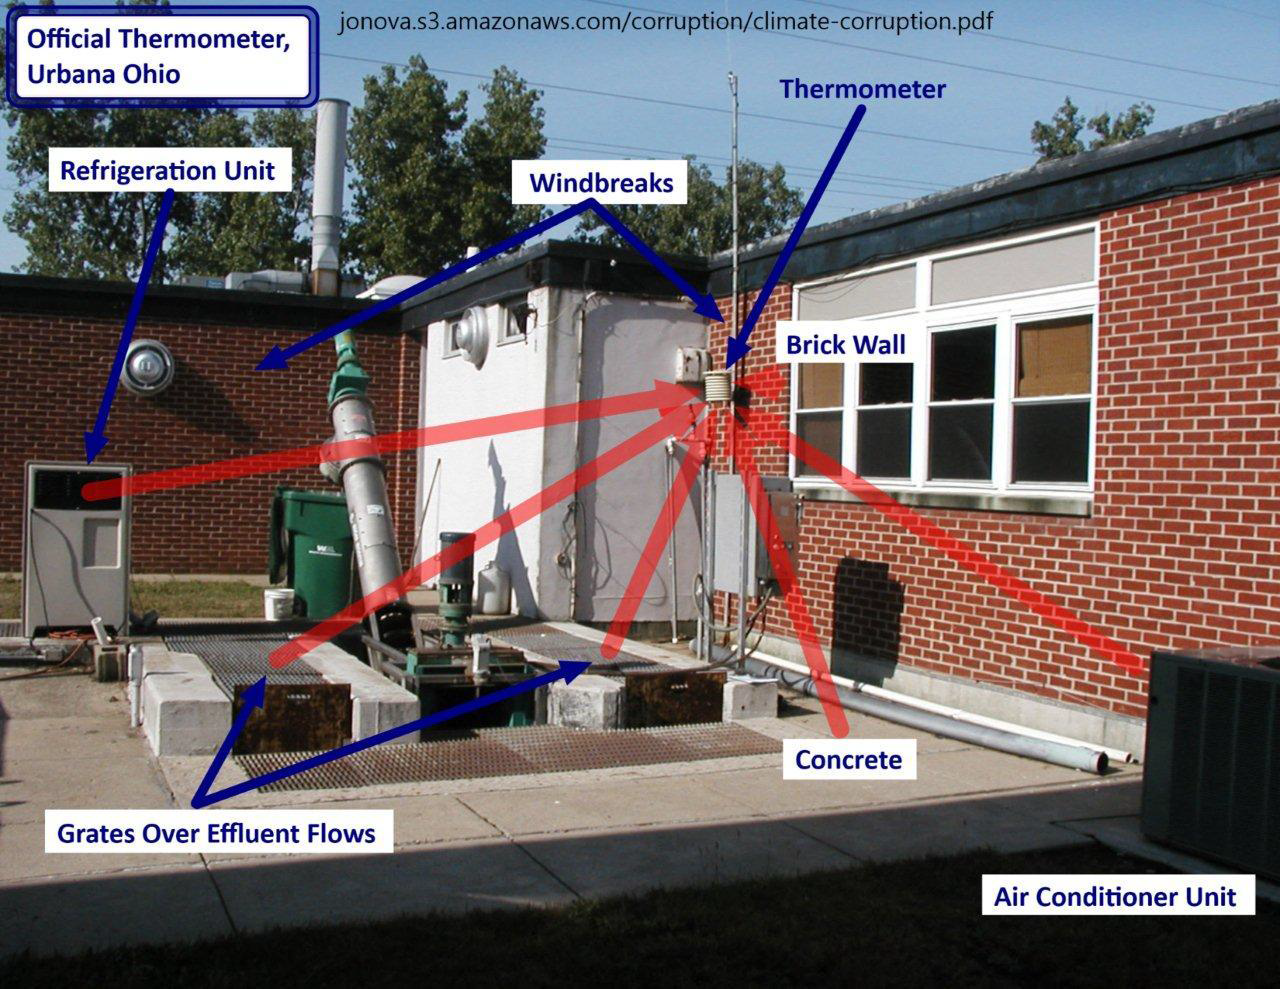
Many of the reporting stations that were once in undeveloped rural areas have experienced either suburban or urban development, or the stations have been moved to more urban settings. It is well documented that some have been, seemingly intentionally, relocated near or at heat sources such as paved parking lots and air conditioners. One reason for relocation near buildings or other structures could be that new automatic-reporting equipment needs to be connected by cable. Rather than dig up parking lots or roads to install units in a grassy or protected area, many have opted to locate them where they can be directly connected without involving costly excavation, although such sites do not meet the stated requirements.
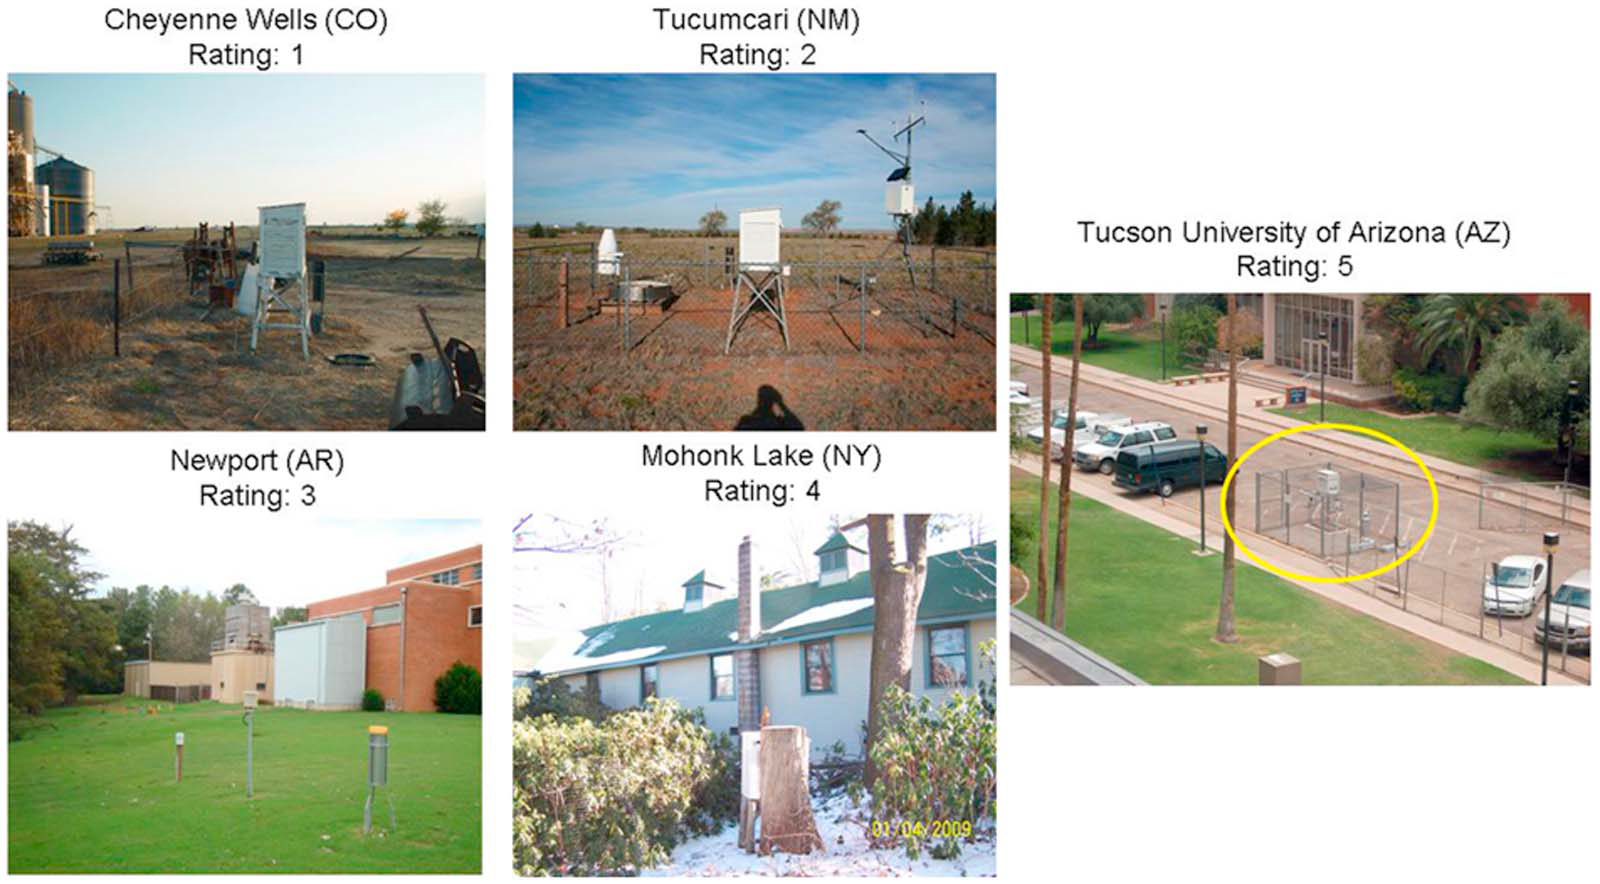
Rating system for locating weather stations
Instead of excluding data from stations that are poorly situated, a convoluted mathematical algorithm (scheme) is used to “correct” it to presumed pre-industrial levels. In spite of all this, it appears that there has been no net warming since the late 1990s and even a slight cooling since 2005. One other problem with the new equipment is that it has a faster response time that records brief, transient signals such as car or plane exhausts that were not picked up by the older equipment. Because the equipment is designed to report maximum and minimum temperatures, this can create a false result.
[1] Ross McKitrick, Professor of Economics and CBE Chair in Sustainable Commerce, University of Guelph, Guelph, Ontario, Canada http://www.rossmckitrick.com
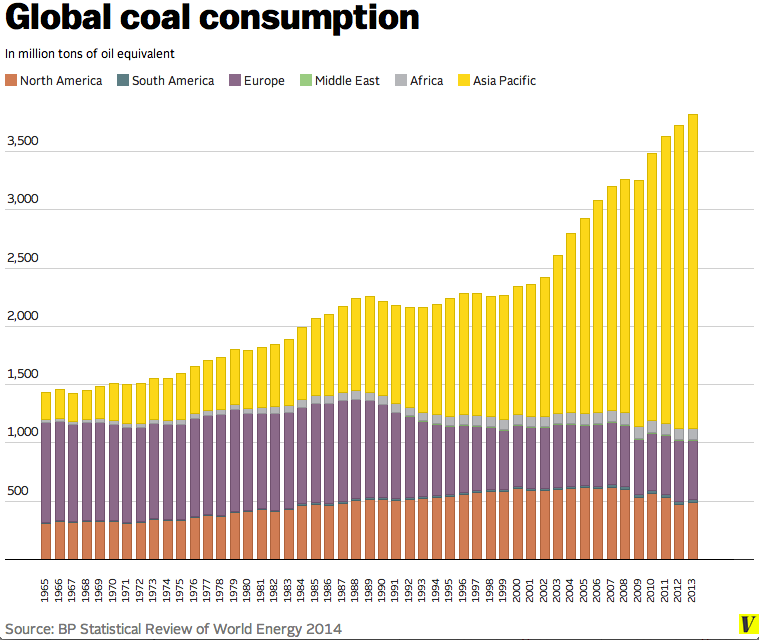
Truth: This is partially true. Industrialization is steadily increasing in developed and developing countries such as China and India. While developed countries are putting restrictions on themselves, international agreements exempt developing countries from such restrictions. These increases more than offset any gains from restrictions on developed countries. However, see previous post AGW Claims vs. Truth – 2 & 2b for why we shouldn’t worry about increased CO2
In addition to industrialization, increased cooking fires and subsistence agriculture to feed an increasing population are also significant contributing factors. CO2 is CO2. There is no escape clause for renewable sources. It doesn’t matter whether it is from fossil fuels or burning dung or wood. Increased population in developing countries means more slash and burn agriculture and more cooking and heating by burning organic material. The modelers assume that renewable sources are exempt as causes because it is a renewable source. This is faulty thinking. Slash and burn agriculture of one acre releases a tenth of the carbon dioxide as ten acres. Subsistence agriculture is harmful to the environment because it results in depletion of soils so that it is necessary to clear more forest lands.
Subsistence farming requires burning to release the nitrogen for crops. Modern agriculture releases far less carbon dioxide than subsistence farming, so keeping people in poverty makes no sense unless your aim is to control or reduce the population in developing countries. It would be better if we helped developing countries develop modern agriculture and industry so they can clean up their act. When people are worried about how to feed their families, there is little time or incentive to do anything about pollution or the environment. In many underdeveloped countries the tradition of having as many children as possible is mostly due to the high rate of mortality in infancy and childhood from unchecked diseases, poor diet, indoor air pollution and poverty. Without the incentive of high infant and childhood mortality, family size and populations could naturally stabilize.
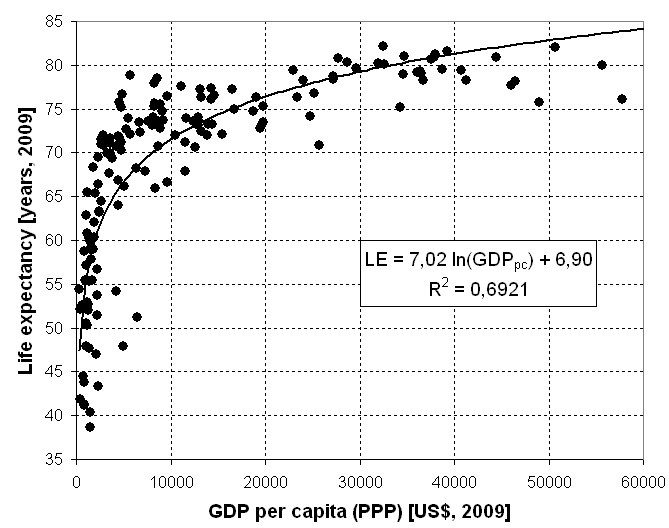
World Life Expectancy Map which tracks well with Poverty RatesLife Expectancy vs. GDP per capita, 2009, World Bank
In Perverted Truth Exposed, Kay Kiser exposes areas of science that have been corrupted by progressive and atheist philosophies disguised as science, including the theories of evolution, origin of life, cosmology, and quantum physics.
The climate change debate presents a modern example of how the perversion of science is politically imposed to support an anti-God, anti-human progress agenda of Marxist control and power while silencing opposition through intimidation. Kiser also answers:
Did Darwin really steal his theory of evolution from Alfred Wallace?
Why did Wallace later abandon the theory as not having sufficient evidence?
If Hubble discovered the expanding universe leading to the Big Bang Theory, why did he continually try to convince others that their conclusion was wrong?
Is man-made carbon dioxide causing global warming or is it a trailing indicator of climate change in a system dominated by solar cycles, cloud cover, and ocean currents?
My book has just been published and is available at Amazon.com World Net Daily Books @wnd.com and other outlets. Soon to be available as an eBook.
Increase in hydrocarbon use since 1950 does not change Glacier shortening rate since Little Ice Age (indicator of warming climate)
Claim 4. Manmade CO2 levels have been rising rapidly due to increased industrialization and populations since the 1950s.
Truth: CO2 levels have been steadily rising along with warming since the Little Ice Age. Recent increases in industrialization and population appear to have contributed to the increase in atmospheric CO2 since the 1950s when fossil fuel consumption began increasing. Rising temperatures have also contributed to increased CO2 because it is less soluble in warmer ocean water and is thus released. it is unclear how much is from manmade sources and how much is from natural processes, but some estimate put it at 5%. However, if CO2 is not responsible for global warming, (see previous posts) increased levels shouldn’t alarm anyone and in fact increased CO2 should be celebrated as a plant growth promoter.
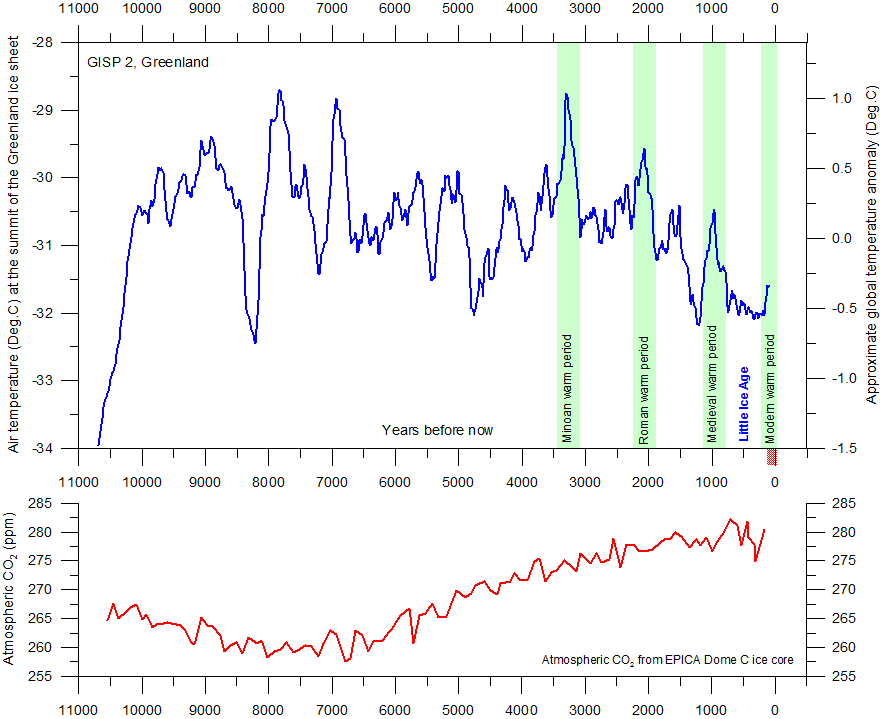
Eleven thousand year temperature and CO2 level record from ice cores
Predicted hot spot from water vapor forcing is missing
Claim 3. Carbon dioxide is important because it has a forcing effect on other factors such as water vapor which magnify warming effects.
Truth: Since the atmospheric absorption of CO2 is already near saturation, (see previous post), very little additional heating can take place due to increased CO2. Contrary to AGW advocates, increased water vapor from warming doesn’t stay as vapor to trap heat near the surface. It forms low altitude clouds that strongly reflect solar heat back out into space, overwhelming any trapped re-radiation from the Earth and having an overall cooling effect. The models, which assume water vapor remains as vapor, predict an atmospheric “hot spot” at middle altitudes. Weather balloons and satellites have failed to find this assumed hot spot, which is the signature of atmospheric forcing of global warming in computer models. Due to low altitude clouds reflecting sunlight back into space, any feedback is negative (cooling), not positive (warming) as assumed in computer models. For earlier posts, go to http:realscienceblog.com
AGW Claim 2. Manmade carbon dioxide (CO2) is the main cause of global warming
Truth: a.) Carbon dioxide is a minor player in any further warming. It is uniformly distributed in the atmosphere but only absorbs infrared (heat) in a very narrow wavelength range. The CO2 wavelength range is outside the range of most of the solar radiance that penetrates our atmosphere. It falls roughly inside the wavelength range of temperatures re-radiated when solar radiation heats the Earth’s surface.
The atmospheric CO2 already absorbs almost all of the radiation that it can in that wavelength range. Most of the warming effect of CO2 has already occurred in the past and is one of the reasons our planet is not a frozen wasteland. Any increase in CO2 will have a very minor effect. With CO2 absorption near saturation, almost all of the re-radiated heat in that wavelength range is already being trapped, so it can have little or no effect on future increases in temperature or supposed forcing of water vapor. (will be explained in claim 3 analysis in future posts.) With CO2 essentially eliminated as a source, any increase in temperature must be from other sources.
This figure above requires a bit of explaining. The top spectrum shows the wavelengths at which the atmosphere transmits light and heat as well as the blackbody idealized curves for no absorption. It is a little misleading because the data is not based on actual solar and earth data. It is based on two experimental heat sources, one centered at 5525 K (5252o C or 9485o F), the approximate temperature of solar radiation, and one centered in the range of 210 to 310 K (-63o C to 36.8o C or -82oF to 98o F), the approximate temperature range of re-radiated heat from the earth. In reality, solar radiation power, (Watts/m2/micron), is six million times as strong as the power of re-radiated heat from the Earth.
The other spectra are absorption[1] spectra. The first one shows the relative percent absorption by total atmospheric gases at various wavelengths, (note that this spectrum is practically the inverse of the transmission spectrum above it), and the spectra below that show the absorption wavelength ranges of individual atmospheric gases, (but not the relative strength of that absorption in reality). As experimental, not real atmospheric, data they can only tell us the wavelength ranges of the absorption, not their relative strengths in the atmosphere.
Note that CO2 absorbs in the 15 micron range[2], which is within both the range of re-radiated heat and the strong absorption by water vapor, of which the CO2 peak forms a mere shoulder. CO2, in the atmosphere is evenly distributed and is near-saturation level at this wavelength. That means that little if any re-radiated heat can escape through the blanket of CO2, which is why our earth is not a frozen wasteland. This also mean that adding more CO2 will have little effect on future temperatures. Lesser CO2 peaks in the 2.7 and 4.3 micron ranges only contribute in a minor way. The first is completely covered by a water vapor absorption peak and the second forms a shoulder in another water vapor peak. These minor peaks occur in a region where both solar radiation and re-radiation are minimized. Methane and nitrous oxide are also shown to be minor players, having narrow absorption ranges and are at low concentrations in the atmosphere. Note too that ozone blocks most of the ultraviolet light from the sun.
b.) Water is by far the most important greenhouse gas/liquid in the form of vapor, high and low altitude clouds, rain and snow, which both absorb and reflect in-coming sunlight and re-radiated heat from the surface. Water vapor is not uniformly distributed in the atmosphere, being concentrated near the earth, it strongly absorbs heat in a wide range of wavelengths. More heat means more water vapor evaporating from the oceans. Sounds pretty scary, doesn’t it? Contrary to what is assumed by climate modelers, who use this to claim forcing by CO2, the extra vapor doesn’t remain as vapor. It quickly forms low altitude clouds that strongly reflect in-coming sunlight and heat into space. Any re-radiated heat from the surface that may be trapped by clouds is a small fraction compared to the in-coming solar radiation, so blocking solar radiation has a net cooling effect that overwhelms any increases in trapped re-radiation. High altitude clouds tend to trap heat from being re-radiated into space, but have little effect because the increases in cloud cover due to warming are mostly in low altitude clouds.
c.) Methane, like CO2, only absorbs heat in narrow wavelength ranges far from most of solar heat radiance, so that water, with its broad absorbance spectrum, trumps all other greenhouse gases. Like CO2, methane is at or near its absorbance saturation point in the atmosphere so that increases would have little effect. While it is true that continued warming could result in release of methane from melting permafrost, it would have a relatively minor effect on global temperatures. Methane is derived mostly from decaying organic material and from natural seeps on the land and under the sea, as well as termites and ruminant flatulence. Methane absorbs 29 times as much heat per volume as carbon dioxide but at 1.8 ppbv[3], (.00000018 percent), compared to CO2 at 380 ppmv[4], (0.038 percent), it is recognized as a minor player in greenhouse warming along with Ozone (O3) and Nitrous Oxide (N2O).
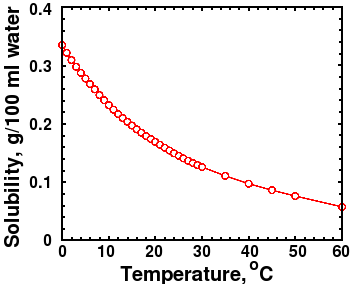
CO2 Solubility in Water vs Temperature
d.) Manmade carbon dioxide is estimated to be about 5 percent (1/20th) of the total CO2 emitted. Animals and man are relatively minor contributors. Decaying organic matter is the major source, followed by volcanic activity and release from warmer oceans. Warmer water releases more CO2 than cooler water due to decreased solubility of CO2 with rising temperature. Many studies show that atmospheric CO2 concentration rises AFTER warming, not before. So which is the cause and which is the effect?
See next post for the beneficial effects of CO2 on plant life.
[1] Transmission and Absorption are inversely related by the formula A = 1/log T.
[2] The horizontal axis is a log scale in microns so that the 1 to 10 range is in units of 1 and the 10 to 70 range is in tens.